Free - KPI Dashboard Template PPT & Google Slides Presentation

Free
Real estate KPI dashboard showing quarterly data in a green colored pie chart and bar graphs across various categories.
P.ID : 1636
    9.1K+ views
    1.7K+ Downloads
    Get Custom Slides by Experts
    Instantly Access Templates in PowerPoint

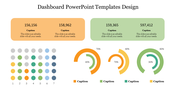
    KPI Dashboard Presentation Slide

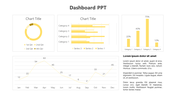
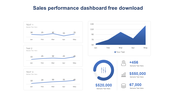
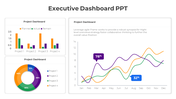
    In the fiercely competitive world of real estate, keeping a finger on the pulse of your key performance indicators (KPIs) is crucial for achieving success. That's where a KPI dashboard comes in. With this powerful tool, you can effortlessly track and measure critical metrics such as sales growth, revenue, and occupancy rates, among others, giving you the insight you need to make data-driven decisions. And with our modern KPI dashboard template, you can easily create an informative presentation with pie charts and bar charts to showcase your real estate KPIs and provide invaluable insights into your business's performance.

    Features of the template

    • 100% customizable slides and easy to download.
    • Slides are available in different nodes & colors.
    • The slide contains 16:9 and 4:3 formats.
    • Easy to change the colors of the slide quickly.
    • Well-crafted template with an instant download facility.
    • Highly compatible with PowerPoint and Google Slides.
    • Designed with editable bar and pie charts.
    • It has an excellent KPI dashboard for real estate business.  
    Advertisement

    You May Also Like These PowerPoint Templates

    Add to Wishlist
    Download
    AI Customize
    PPT template featuring a marketing dashboard with a colorful pie chart, bar graph, and progress bars for data presentation.
    Add to Wishlist
    Download
    AI Customize
    Circular gauge template with sections in red, orange, yellow, green, and dark green, with captions on either side.
    Add to Wishlist
    Download
    AI Customize
    Infographic dashboard featuring a world map with COVID-19 case data, a gender-based death rate chart, and a pie chart.
    Free
    Add to Wishlist
    Download
    AI Customize
    Executive dashboard slide with five numbered circular icons on dark blue shapes, each labeled with key principles.
    Add to Wishlist
    Download
    AI Customize
    PowerPoint slide for executive dashboard featuring four icons target, speed, error reduction, and growth with text area.
    Add to Wishlist
    Download
    AI Customize
    KPI dashboard template PowerPoint slide featuring three sections for data visualization.
    Add to Wishlist
    Download
    AI Customize
    Dashboard layout including a bar chart of company data, a pie chart for quarterly sales distribution.
    Add to Wishlist
    Download
    AI Customize
    Dashboard gauges with red, yellow, green indicators showing low, medium, high performance against a gray background.
    Free
    Add to Wishlist
    Download
    AI Customize
    Pie chart in orange, red, green, and blue sections with two text labels on either side, highlighting sales performance.
    Add to Wishlist
    Download
    AI Customize
    KPI dashboard slide with key metrics for business, development, and downloads, showing percentages with icons.
    Add to Wishlist
    Download
    AI Customize
    Attractive PowerPoint KPI Dashboard Presentation Template
    Add to Wishlist
    Download
    AI Customize
    Dashboard gauge chart PPT template with color coded sections for big loss, loss, break even, profit, and high profit.
    Add to Wishlist
    Download
    AI Customize
    Internet speed dashboard featuring two routers with speed performance indicators and mobile phones.
    Free
    Add to Wishlist
    Download
    AI Customize
    Six-layer bullseye diagram executive dashboard with annotations on each layer, arranged symmetrically around the circle.
    Free
    Add to Wishlist
    Download
    AI Customize
    Green radial gauge with a modern layout, surrounded by five labeled rectangular sections on a neutral background.
    Add to Wishlist
    Download
    AI Customize
    Colorful dashboard PPT slide with world map, pie charts, bar graphs, and metrics with placeholder text.