Get Executive Dashboard PPT And Google Slides Template

Dashboard with bar chart comparing planned vs. actual tasks for projects, pie chart for project share, and a line graph displaying project data.
P.ID : 3862
    896 views
    99 Downloads
    Get Custom Slides by Experts
    Instantly Access Templates in PowerPoint

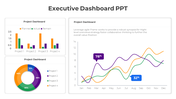
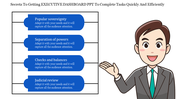
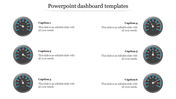
    Executive Dashboard PowerPoint Template 


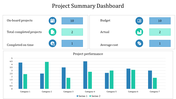
    Presenting complex business data has never been easier with our executive dashboard PowerPoint templates. Designed for professionals who want to convey key performance indicators PPT and metrics effectively, these templates offer a visually appealing and data-driven approach. With fully customizable features, you can tailor the templates to match your specific business needs and impress your audience.

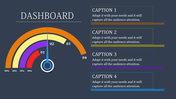
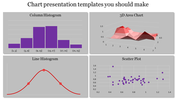
    This table template provide a comprehensive overview of your company's performance, allowing you to track progress, identify trends, and make informed decisions. The executive template include a range of charts, graphs, and infographics to help you visualize data and communicate insights clearly. 

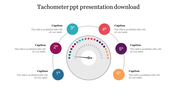
    Created with the modern professional in mind, our executive dashboard PowerPoint templates are easy to use and highly versatile. You can effortlessly add, remove, or modify data to ensure your presentations are up-to-date and impactful. The templates are designed to be visually engaging, helping you capture your audience's attention and deliver your message effectively.

    Features of this template


    • 100% customizable slides and easy to download.
    • The slide contains 16:9 and 4:3 formats.
    • Easy to change the colors of the slide quickly.
    • Highly compatible with PowerPoint and Google Slides.
    Advertisement

    You May Also Like These PowerPoint Templates

    Add to Wishlist
    Download
    AI Customize
    Circular gauge template with sections in red, orange, yellow, green, and dark green, with captions on either side.
    Add to Wishlist
    Download
    AI Customize
    Infographic dashboard featuring a world map with COVID-19 case data, a gender-based death rate chart, and a pie chart.
    Add to Wishlist
    Download
    AI Customize
    Sashboard design featuring three plant species data and corresponding progress meters in red, green, and blue.
    Add to Wishlist
    Download
    AI Customize
    Chart PPT template showing 4 progress circles with percentages and color coded sections for Blue, Green, Yellow, and Orange.
    Free
    Add to Wishlist
    Download
    AI Customize
    Executive dashboard slide with five numbered circular icons on dark blue shapes, each labeled with key principles.
    Add to Wishlist
    Download
    AI Customize
    Dashboard layout with bar, pie, and stacked charts in yellow, orange, red, and green on a white background.
    Add to Wishlist
    Download
    AI Customize
    Infographic featuring pie graph, horizontal and vertical bar charts for visualizing data trends and comparisons.
    Add to Wishlist
    Download
    AI Customize
    PowerPoint slide for executive dashboard featuring four icons target, speed, error reduction, and growth with text area.
    Add to Wishlist
    Download
    AI Customize
    Executive slide showing expense meters, world sales performance, and bar graphs for margin, expenses, and revenue by month.
    Add to Wishlist
    Download
    AI Customize
    KPI template displaying financial metrics, including sales, profitability, liquidity, and leverage, with two gauge charts.
    Add to Wishlist
    Download
    AI Customize
    Executive dashboard slide with a pie chart, bar graph, area chart, and a profile section for job title and details.
    Add to Wishlist
    Download
    AI Customize
    KPI dashboard template PowerPoint slide featuring three sections for data visualization.
    Add to Wishlist
    Download
    AI Customize
    Dashboard layout including a bar chart of company data, a pie chart for quarterly sales distribution.
    Add to Wishlist
    Download
    AI Customize
    KPI template with three gauges displaying progress levels for sales, production, and downloads.
    Add to Wishlist
    Download
    AI Customize
    Dashboard gauges with red, yellow, green indicators showing low, medium, high performance against a gray background.
    Free
    Add to Wishlist
    Download
    AI Customize
    Pie chart in orange, red, green, and blue sections with two text labels on either side, highlighting sales performance.
    Add to Wishlist
    Download
    AI Customize
    KPI dashboard slide with key metrics for business, development, and downloads, showing percentages with icons.