Affordable Dashboard PowerPoint And Google Slides Template

Dashboard Presentation Slide
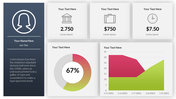
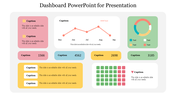
Transform presentations into collaborative experiences. The Dashboard Slide supports multiple users working simultaneously, fostering a culture of teamwork that brings out the best in your data-driven endeavors.
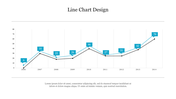
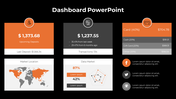
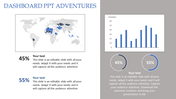
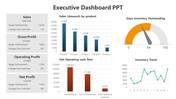
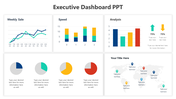
With six unique charts that are intended to provide your audience with a comprehensive understanding of your data, our Dashboard PPT template will elevate your presentations. Every chart has a distinct function and offers insightful information about your data, ranging from illustrating weekly sales patterns to decomposing product shares among categories. Your research is further enhanced by the inclusion of a forecast sales chart and an average graph, which allow for both past reflection and future planning. The charts may be customized to meet your branding and presentation demands thanks to the three rows dedicated to widget customization and the thoughtful use of color that improves visual clarity. Professionals looking to accurately and effectively convey complicated facts with precision may find this template to be a useful tool.
The Dashboard PPT template is a valuable resource for professionals across various industries, including business executives, data analysts, marketers, educators, and project managers. Its dynamic features and visually appealing design make it an ideal tool for presenting complex data, strategic insights, project updates, and educational content. Whether conveying key performance indicators, marketing metrics, or project milestones, this template enhances the impact of presentations, ensuring that information is communicated in a clear, cohesive, and visually compelling manner.
Design your presentations instantly. Download our Dashboard PPT template now for visually compelling data storytelling.
Features of the Templates
- Completely adaptable.
- The slide show is in 4:3, 16:9, zip format.
- There is very strong connectivity with Google Slides and PowerPoint.
- It is simple and quick to alter the slide's color.
- An efficient template that can be easily accessed immediately.
- Easy to download.


You May Also Like These PowerPoint Templates


Add to Wishlist
Download
Edit

Add to Wishlist
Download
Edit

Add to Wishlist
Download
Edit

Add to Wishlist
Download
Edit

Add to Wishlist
Download
Edit

Add to Wishlist
Download
Edit

Add to Wishlist
Download
Edit

Add to Wishlist
Download
Edit

Add to Wishlist
Download
Edit


Add to Wishlist
Download
Edit

Add to Wishlist
Download
Edit

Add to Wishlist
Download
Edit

Add to Wishlist
Download
Edit

Add to Wishlist
Download
Edit

Add to Wishlist
Download
Edit

Add to Wishlist
Download
Edit

Add to Wishlist
Download
Edit
