Creative Chart Presentation PowerPoint Template Design

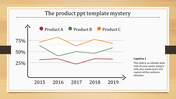
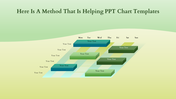
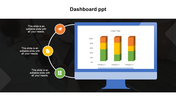
Chart Presentation PowerPoint Template Design
The Chart Presentation PowerPoint Template is a dynamic tool designed to visualize data in a 2x2 matrix format. Perfect for illustrating relationships between skill and will in various contexts, this template simplifies complex concepts into clear, actionable visuals. Use it to depict different combinations of skill and will across four quadrants, aiding in strategic decision-making, analysis, or planning.
Tailored for professionals across industries - from managers and educators to consultants and analysts - this template caters to those needing to convey skill-will dynamics effectively.
This Chart Presentation PowerPoint Template is a dynamic visual aid that simplifies complex skill and will dynamics into a clear 2x2 matrix format. Its user-friendly interface allows seamless customization, fitting diverse presentation styles, and contexts effortlessly. Accessible in PowerPoint "16:9", "4:3", and zip formats, this template ensures compatibility across various setups, empowering users to effortlessly convey nuanced concepts and make impactful presentations.
Download right now!


You May Also Like These PowerPoint Templates
Add to Wishlist
Download
Edit

Add to Wishlist
Download
Edit


Add to Wishlist
Download
Edit

Add to Wishlist
Download
Edit

Add to Wishlist
Download
Edit

Add to Wishlist
Download
Edit

Add to Wishlist
Download
Edit

Add to Wishlist
Download
Edit

Add to Wishlist
Download
Edit


Add to Wishlist
Download
Edit

Add to Wishlist
Download
Edit


Add to Wishlist
Download
Edit

Add to Wishlist
Download
Edit

Add to Wishlist
Download
Edit

Add to Wishlist
Download
Edit


