Stunning Dashboard PowerPoint For Presentation

A colorful dashboard PowerPoint slide featuring graphs, stats, and a pie chart for a data driven presentation with captions.
P.ID : 52687
    683 views
    90 Downloads
    Get Custom Slides by Experts
    Instantly Access Templates in PowerPoint

    Dashboard For Business and Projects

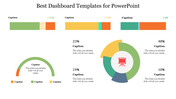
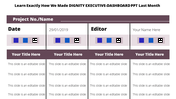
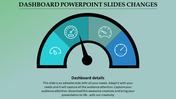
    Now you can monitor all departments and their work simply through the dashboard. Dashboards give an overview of a particular business or process and are used to assess performance. You can view the works at a glance, also known as the control panel. This dashboard slide is designed with multiple large sections with lots of spaces to add views on a particular area, and also, you can enter the value and show up a condensed view of your overall sectors in your business. There are squares and rectangle boxes where you can add captions and texts conveniently. Download Now!! 

    Features of this template:

    • Innovative slide background designs
    • 100% easy to edit and customize slides
    • The slide contained 16:9 and 4:3 formats.
    • Easy to change the slide colors quickly.
    • The elegant look of this template will give life to your process presentation.
    Advertisement

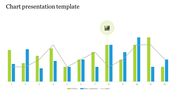
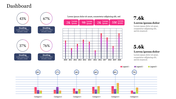
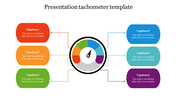
    You May Also Like These PowerPoint Templates

    Add to Wishlist
    Download
    AI Customize
    Dashboard layout with gauges, bar charts, line graphs, and progress indicators for business performance metrics.
    Add to Wishlist
    Download
    AI Customize
    Business dashboard with expense bar chart, executive distribution, sales pie chart, and revenue gauge.
    Free
    Add to Wishlist
    Download
    AI Customize
    Purple bar chart PPT slide with years 2018 to 2021 and percentages and a businesswoman presenting the information.
    Add to Wishlist
    Download
    AI Customize
    Green speedometer graphics illustrating performance levels at 70, 50, 55, and 85 percent in a PowerPoint template.
    Add to Wishlist
    Download
    AI Customize
    Chart template featuring bar, line, and calendar charts with editable placeholders for Q1, Q2, and monthly data.
    Free
    Add to Wishlist
    Download
    AI Customize
    Layered area chart with Series 1 in yellow, Series 2 in orange, and Series 3 in black, showing data trends over time.
    Add to Wishlist
    Download
    AI Customize
    Clustered bar chart comparing data across quarters with horizontal bars in various colors.
    Add to Wishlist
    Download
    AI Customize
    Slide with three vertical boxes in blue, red, and green banners, and rounded icons labeled K, W, and L for learning stages.
    Add to Wishlist
    Download
    AI Customize
    PowerPoint chart template showing stacked bar graphs with different categories and values for each year from 2016 to 2019.
    Add to Wishlist
    Download
    AI Customize
    Line graph infographic showing data from 2015 to 2020, with three colored lines in purple, yellow, and green, and text.
    Add to Wishlist
    Download
    AI Customize
    Donut chart in blue and orange displaying percentage, with matching colored caption boxes on either side.
    Add to Wishlist
    Download
    AI Customize
    Our Predesigned Chart Templates PPT Slides Designs
    Add to Wishlist
    Download
    AI Customize
    A tachometer graphic for PowerPoint, featuring different colored sections and text placeholders.
    Add to Wishlist
    Download
    AI Customize
    Four yellow speedometer graphics showing percentages of 70%, 50%, 55%, and 85% placed in a white background.
    Add to Wishlist
    Download
    AI Customize
    KWL chart slide with three columns in blue, red, and gold, representing learning insights.
    Add to Wishlist
    Download
    AI Customize
    Infographic with four bar graphs, each showing data points A to D, and captions areas in green boxes.
    Add to Wishlist
    Download
    AI Customize
    Dashboard with a bar chart and pie chart in purple shades, comparing project status across regional shares.