Executive Dashboard PPT Template With Chart Diagram


Editable Executive Dashboard PPT
Template
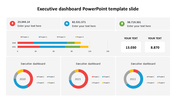
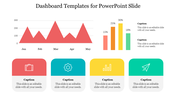
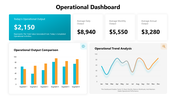
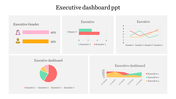
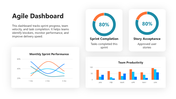
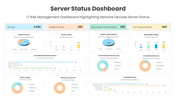
Are you ready to turn raw stats into compelling stories? Imagine a world where data visualization and analysis are not only accessible but engaging. Where insights fly off the screen, for clarity and depth. That world is now a reality with our Executive Dashboard PPT template, which is designed to empower professionals, students, and anyone else looking to simplify complex data sets. This carefully crafted slide is adorned with four separate charts, each serving its specific purpose in representing data:
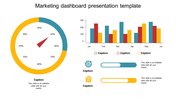
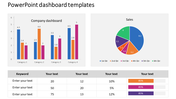
- Pie Chart: Quarterly results are broken down by color—accurate and visually appealing.
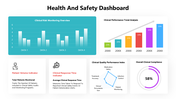
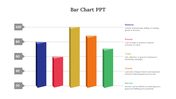
- Bar graphs: paired groups for comparative analysis, showing trends and patterns.
- Stacked Bars: Creates a layered look at multiple series, allowing for deeper exploration.
- Horizontal bars: visualization of increases, decreases, and totals in groups.
The key to this pattern is customization. Customize each element to your specific needs—change the color, resize, or change the texture. Entrepreneurs Executives, managers, analysts—strive to unlock actionable insights. Click below to download Executive Dashboard PPT Templates and Google Slides Themes.
Features of the template:
- Slides are available in 4:3 & 16:9
- Well-crafted template with instant download.
- Get slides that are 100% customizable and easy to download


You May Also Like These PowerPoint Templates


Showing20 of69,218 templates