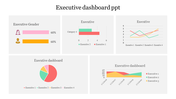
Customized Executive Dashboard PPT Slide With Charts

Executive dashboard slide with gender bar chart, line graph,pie chart, and area chart for executive data analysis.
P.ID : 3933
    832 views
    44 Downloads
    Get Custom Slides by Experts
    Instantly Access Templates in PowerPoint
    How to Use an Executive Dashboard PPT Presentation to Make a Better Pitch 
    If you are seeking an executive dashboard PPT presentation to generate a short sales pitch for a potential client, you may be wondering what it takes to create a presentation that is entertaining and makes a buzz on your behalf. Since so many executives will give presentations to various groups and individuals throughout the day, you may wish to use different models when working on the same presentation. For example, you may want to take one model and mix it up with another model. If you are using an executive dashboard PPT presentation to market a product or service, you can choose a few characteristics to incorporate into your presentation. One important characteristic to include is providing information about the benefit of the product or service. You want to emphasize how a particular product or service will benefit the audience that you are addressing. The same goes for using stories to illustrate how the product or service will benefit someone. 
    The key to the presentation is ensuring that you have convincing stories to explain the benefits. Also, you may wish to add humor to your presentation. If you do not have this talent, consider enlisting the services of an audio or video professional to help you make this presentation fun. Another innovative aspect of an executive dashboard PPT presentation is to let the audience know who you are and why you are the right person to talk to. People love to talk to someone who seems very knowledgeable about their problem or topic. You will notice that people who present similar products or services have better success when working with each other, and the person is named that particular individual. This doesn't mean that you should give them their name or number, but it does mean that you should understand the importance of lead data and how you can use this data to your advantage. You also want to inform your audience that if they would like more information, they should call you. By using an executive dashboard PPT presentation, you will have a powerful tool to use when promoting your business. You can create a dynamic presentation that will have the audience talking about your product or service. 
    Advertisement

    You May Also Like These PowerPoint Templates

    Free
    Add to Wishlist
    Download
    AI Customize
    Template with six green bar graphs labeled by years from 2016 to 2021, and a woman in a formal outfit.
    Free
    Add to Wishlist
    Download
    AI Customize
    Bar chart comparing business targets and profits across quarters, with orange and blue bars labeled by month.
    Free
    Add to Wishlist
    Download
    AI Customize
    PPT slide with a line chart showing monthly data and two pie charts for quarterly breakdown.
    Add to Wishlist
    Download
    AI Customize
    Budget slide featuring a colorful donut chart with percentages and five categories with placeholder text.
    Add to Wishlist
    Download
    AI Customize
    Electricity dashboard showing a bar chart on the left and a line chart on the right, depicting electricity data.
    Add to Wishlist
    Download
    AI Customize
    Dashboard slide with three gauges displaying percentage levels, labeled low, middle, and high with placeholder text.
    Add to Wishlist
    Download
    AI Customize
    Colorful pie chart in PowerPoint slide showing 60, 30, and 10 percent segments with text boxes on a white backdrop.
    Add to Wishlist
    Download
    AI Customize
    Executive dashboard slide featuring a bar chart for weekly data, financial stats, line graphs, and three progress indicators.
    Free
    Add to Wishlist
    Download
    AI Customize
    Five triangular red pyramids arranged by size with corresponding percentage values, set against a minimalist gray background.
    Add to Wishlist
    Download
    AI Customize
    Dashboard overview slide displaying traffic, payment, server load, expenses, and product metrics using graphs and charts.
    Free
    Add to Wishlist
    Download
    AI Customize
    Bar graph comparing financial data with blue and purple theme, with a text box explaining a high level approach.
    Add to Wishlist
    Download
    AI Customize
    PowerPoint template showing a line graph with three products A, B, and C plotted over time from 2015 to 2019.
    Add to Wishlist
    Download
    AI Customize
    Animated slide design with orange gradient sidebar and three bar charts in blue, yellow, and green for different years.
    Add to Wishlist
    Download
    AI Customize
    Slide with a pie chart and a numbered list of five levels, each in orange, red, blue, green, and yellow.
    Add to Wishlist
    Download
    AI Customize
    Cycle chart slide featuring four percentage indicators in teal, green, blue, and red, with captions beow.
    Free
    Add to Wishlist
    Download
    AI Customize
    Timeline slide with horizontal bars in shades of green and blue, aligned to weekdays with placeholder text.
    Free
    Add to Wishlist
    Download
    AI Customize
    Six-layer bullseye diagram executive dashboard with annotations on each layer, arranged symmetrically around the circle.
    Add to Wishlist
    Download
    AI Customize
    Attractive Project Management Dashboard Slide Template
    Free
    Add to Wishlist
    Download
    AI Customize
    Green radial gauge with a modern layout, surrounded by five labeled rectangular sections on a neutral background.
    Add to Wishlist
    Download
    AI Customize
    Colorful dashboard PPT slide with world map, pie charts, bar graphs, and metrics with placeholder text.