MILESTONE 🌟 5 Million+ creative minds trust SlideEgg! Grab 80% OFF

Three Node Dashboard PPT Template For Presentation

Dashboard slide with three gauges displaying percentage levels, labeled low, middle, and high with placeholder text.
P.ID : 5838
    807 views
    42 Downloads
    Get Custom Slides by Experts
    Instantly Access Templates in PowerPoint

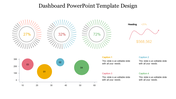
    Editable Dashboard PowerPoint Template


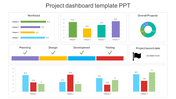
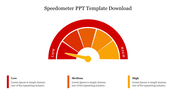
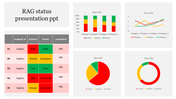
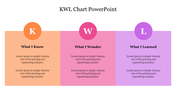
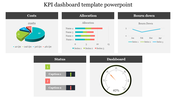
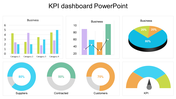
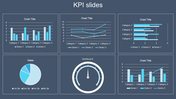
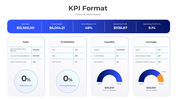
    Struggling to deliver complex data in a way that resonates with your audience? Look no further than our Business Dashboard PPT Template. These pre-made slides will help turn your data into clear, concise, and visually appealing dashboards that will grab your audience’s attention and create a lasting impression. Our dashboard PPT templates feature a variety of charts, graphs, and gauges specifically designed to make understanding your data easier. You can customize the templates to your specific needs, and they are easy to use for PowerPoint beginners and experts alike. Anyone who wants to create a professional and informative dashboard presentation can use this template. Marketing professionals Use our templates to present data to colleagues, clients, or investors. Stop struggling with effective data presentation. Download our Dashboard PPT Templates and Google Slides Themes today to see the difference they can make in your next presentation.

    Features of the template


    • Slides are available in 4:3 & 16:9
    • Well-crafted template with instant download.
    • Get slides that are 100% customizable and easy to download
    Advertisement

    You May Also Like These PowerPoint Templates

    Add to Wishlist
    Download
    AI Customize
    Radar PowerPoint Presentation Templates and Google Slides
    Add to Wishlist
    Download
    AI Customize
    Relationship chart slide with colored blocks connected by curving lines representing data flow with placeholder text.
    Add to Wishlist
    Download
    AI Customize
    Pentagon-shaped spider chart displaying two datasets in red and blue with two numbered caption areas.
    Add to Wishlist
    Download
    AI Customize
    Slide featuring a blue umbrella graphic with three labeled sections and two text boxes on the right.
    Free
    Add to Wishlist
    Download
    AI Customize
    Four vertical bar charts in orange, blue, red, and green on a white background, each with captions below.
    Add to Wishlist
    Download
    AI Customize
    Three semi circle gauges in pastel colors, with percentage labels above, and related text and icons beneath.
    Add to Wishlist
    Download
    AI Customize
    Three speedometers showing progress percentages: 25%, 50%, and 75%, with gradient colors in yellow, orange, and red.
    Add to Wishlist
    Download
    AI Customize
    Colorful pie chart with four segments in blue, purple, red, and orange, with matching text boxes showing percentages.
    Add to Wishlist
    Download
    AI Customize
    Online marketing dashboard slide showing graphs for TV Media, Facebook, Direct Marketing, and YouTube performance.
    Add to Wishlist
    Download
    AI Customize
    Metrics Dashboard PowerPoint Template & Google Slides
    Add to Wishlist
    Download
    AI Customize
    Slide with colorful bar and line graph, alongside a pie chart, featuring red, teal, blue, and purple elements on white.
    Add to Wishlist
    Download
    AI Customize
    Blank chart slide with a weekly layout from monday to sunday, featuring a grid for scheduling or organizing tasks.
    Free
    Add to Wishlist
    Download
    AI Customize
    Slide with three gauge meters in orange, yellow, and gray, each paired with a table for KPI metrics.
    Free
    Add to Wishlist
    Download
    AI Customize
    Hexagonal radar chart showing five colorful sales metrics at the edges, alongside three numbered captions listed to the left.
    Free
    Add to Wishlist
    Download
    AI Customize
    KPI presentation template displaying colorful charts for revenue, units sold, and product category analysis.
    Add to Wishlist
    Download
    AI Customize
    Hoshin Kanri slide with a blue grid design labeled sections for annual objectives and a compass icon at the bottom.