MILESTONE 🌟 5 Million+ creative minds trust SlideEgg! Grab 80% OFF

KPI Google Slides and PowerPoint Presentation Template

KPI dashboard slide showing multiple charts, including bar, line, pie, and gauge charts with tracking business data.
P.ID : 35540
    5.2K+ views
    690 Downloads
    Get Custom Slides by Experts
    Instantly Access Templates in PowerPoint

    KPI Presentation Slide

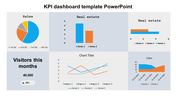
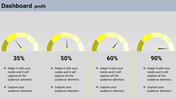
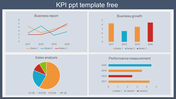
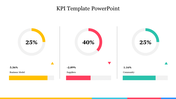
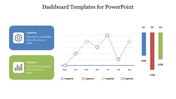
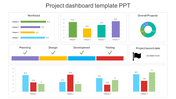
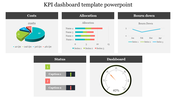
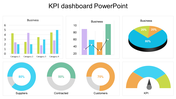
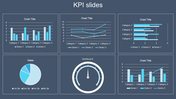
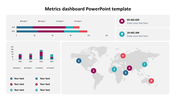
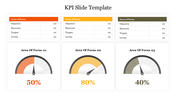
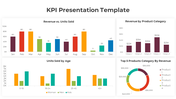
    "KPIs," or Key Performance Indicators, are essential metrics that provide insight into the performance and success of a business or organization. These measured values are used to track progress towards specific goals and objectives, enabling decision-makers to make informed and strategic choices. KPIs are like a compass that guides a company's direction and growth. Our presentation template will be helpful in showcasing KPIs and their progress in an excellent way.

    Features of the template

    • 100% customizable slides and easy to download.
    • Slides are available in different nodes & colors.
    • The slides contain 16:9 and 4:3 formats.
    • Easy to change the colors quickly.
    • It is a well-crafted template with an instant download facility.
    • It is a 100% pre-designed slide.
    • Highly compatible with PowerPoint and Google Slides
    • It has an excellent design to present your idea.
    Advertisement

    You May Also Like These PowerPoint Templates

    Free
    Add to Wishlist
    Download
    AI Customize
    Real estate KPI dashboard showing quarterly data in a green colored pie chart and bar graphs across various categories.
    Free
    Add to Wishlist
    Download
    AI Customize
    KPI slide displaying key performance indicators with many sections and accompanying data charts.
    Add to Wishlist
    Download
    AI Customize
    Dashboard slide showcasing project management KPIs with bar graphs, a line graph, and a pie chart in different colors.
    Add to Wishlist
    Download
    AI Customize
    Project management dashboard with charts for budget, progress, risks, workload, and projected launch date and icons.
    Add to Wishlist
    Download
    AI Customize
    PowerPoint slide with KPI dashboard metrics, including revenue, sales by month, and customer revenue comparison.
    Free
    Add to Wishlist
    Download
    AI Customize
    KPI Dashboard with bubbles for sales, attendance, download, and report and a client location legend.
    Add to Wishlist
    Download
    AI Customize
    KPI Training slide featuring a social media analysis table with metrics for followers, mentions, interactions, and shares.
    Add to Wishlist
    Download
    AI Customize
    Task management dashboard slide showing task numbers and completion percentages with colored gauge icons.
    Add to Wishlist
    Download
    AI Customize
    Revenue dashboard with bar charts, statistics, and sliders showing data metrics in various colors.
    Add to Wishlist
    Download
    AI Customize
    KPI dashboard template with six sections which includes charts, graphs, and numerical data.
    Add to Wishlist
    Download
    AI Customize
    KPI Infographics PowerPoint And Google Slides Themes
    Add to Wishlist
    Download
    AI Customize
    A project management dashboard slide featuring a table of test case data alongside visual graphs and planned progress.
    Add to Wishlist
    Download
    AI Customize
    Dashboard layout with income, expenses, profit, and cash flow figures on the left, a project budget chart in the center.
    Add to Wishlist
    Download
    AI Customize
    Dashboard template with pink charts showing facebook and twitter activity, percentage rings, and a page growth graph.
    Add to Wishlist
    Download
    AI Customize
    KPI slide highlighting essential business metrics alongside color coded sections for quick reference and analysis.
    Add to Wishlist
    Download
    AI Customize
    KPI Dashboard PowerPoint template displaying key metrics, including count of contracts, revenues, and costs.