KPI Presentation PowerPoint Template and Google Slides

KPI Presentation PowerPoint Template and Google Slides
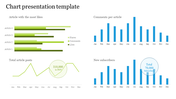
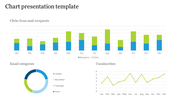
Nail Your Next Presentation with Captivating KPI Slides Imagine captivating your audience with clear, concise, and visually stunning slides that showcase your company's key performance indicators (KPIs). With our professionally designed KPI presentation PowerPoint templates, you can do just that. This template features a visually appealing layout with easy-to-edit charts, graphs, and tables that effectively communicate your KPIs. Empower Anyone to Create Winning Presentations . Whether you're a seasoned professional or a student looking to make a great impression, these templates are perfect for you.
They're easy to use, even for PowerPoint novices, and come with clear instructions to help you get started. It Saves Time and Effort: No need to start from scratch – our templates provide a pre-built framework that you can customize to fit your specific needs. Look Like a Pro: Impress your audience with professional design elements and data visualization techniques. Focus on Your Content: Spend less time formatting and more time crafting your message. Communicate Clearly: Ensure your KPIs are easy to understand and interpret. Download our KPI presentation PowerPoint templates today!
Features of the template:
- Slides are available in different sizes and colors.
- Easy to change the slide colors.
- Well-crafted template with instant download.


You May Also Like These PowerPoint Templates
Add to Wishlist
Download
AI Customize

Add to Wishlist
Download
AI Customize

Add to Wishlist
Download
AI Customize

Add to Wishlist
Download
AI Customize

Add to Wishlist
Download
AI Customize

Add to Wishlist
Download
AI Customize

Add to Wishlist
Download
AI Customize

Add to Wishlist
Download
AI Customize

Add to Wishlist
Download
AI Customize

Add to Wishlist
Download
AI Customize

Add to Wishlist
Download
AI Customize

Add to Wishlist
Download
AI Customize

Add to Wishlist
Download
AI Customize

Add to Wishlist
Download
AI Customize

Add to Wishlist
Download
AI Customize

Add to Wishlist
Download
AI Customize


Add to Wishlist
Download
AI Customize

Add to Wishlist
Download
AI Customize

Add to Wishlist
Download
AI Customize
