Attractive KPI Dashboard Template PowerPoint Presentation

 Canva
Canva
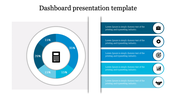
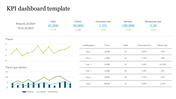

KPI Dashboard Template PowerPoint
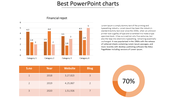
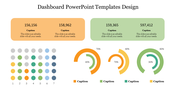
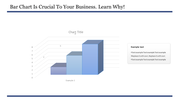
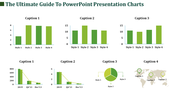
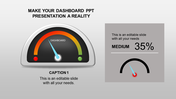
Are you looking for a KPI dashboard for your organization? Let’s try our pre-designed KPI dashboard template PowerPoint presentation. Our dashboard includes Bar charts and sparkline graphs. It provides accurate metrics for your business. At the top of the dashboard, you will see Four nodes with different colors. You can edit the colors, fonts, and text. The template will make it attractive and eye-catching to your audience. Download the Creative KPI dashboard template now to get started.
Features of the Template
- 100% customizable slides and easy to download.
- Slides are available in different nodes & colors.
- The slide contains 16:9 and 4:3 formats.
- Easy to change the colors of the slide quickly.
- Well-crafted template with an instant download facility.
- Attractive KPI Dashboard.
- Engage your audience.


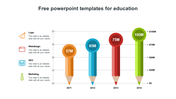
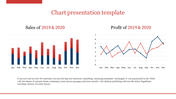
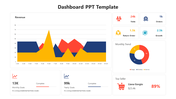
You May Also Like These PowerPoint Templates
Add to Wishlist
Download
AI Customize

Add to Wishlist
Download
AI Customize

Add to Wishlist
Download
AI Customize

Add to Wishlist
Download
AI Customize

Add to Wishlist
Download
AI Customize

Add to Wishlist
Download
AI Customize

Add to Wishlist
Download
AI Customize


Add to Wishlist
Download
AI Customize

Add to Wishlist
Download
AI Customize

Add to Wishlist
Download
AI Customize

Add to Wishlist
Download
AI Customize

Add to Wishlist
Download
AI Customize

Add to Wishlist
Download
AI Customize

Add to Wishlist
Download
AI Customize

Add to Wishlist
Download
AI Customize

Add to Wishlist
Download
AI Customize

Add to Wishlist
Download
AI Customize

Add to Wishlist
Download
AI Customize

Add to Wishlist
Download
AI Customize
