Productivity Chart Presentation Template and Google Slides

Productivity Chart Presentation Template and Google Slides
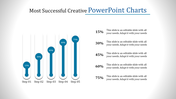
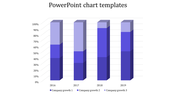
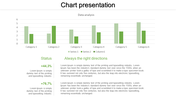
The Chart Presentation PowerPoint template and Google Slides theme feature bar charts and graphs in vibrant blue and red colors, designed to measure productivity across all months. This visually dynamic template provides an effective platform for presenting data, analyzing trends, and highlighting key insights related to productivity metrics.
Each bar chart and graph is meticulously crafted to visually represent productivity levels over time, allowing presenters to effectively communicate performance trends and patterns. The use of contrasting colors enhances visibility and draws attention to important data points, ensuring clarity and comprehension for the audience.
Customize the template by inputting specific productivity data for each month, incorporating annotations or labels to provide context, and adding additional visual elements as needed. Whether used for performance reviews, business reports, or project updates, the Chart Presentation template offers a professional and visually engaging framework for presenting productivity data with clarity and impact.
Features of the template
- 100% customizable slides and easy to download.
- Slides are available in different nodes & colors.
- The slide contains 16:9 and 4:3 formats.
- It is easy to change the colors of the slide quickly.
- Well-crafted template with an instant download facility.


You May Also Like These PowerPoint Templates


Add to Wishlist
Download
AI Customize

Add to Wishlist
Download
AI Customize

Add to Wishlist
Download
AI Customize

Add to Wishlist
Download
AI Customize

Add to Wishlist
Download
AI Customize

Add to Wishlist
Download
AI Customize

Add to Wishlist
Download
AI Customize

Add to Wishlist
Download
AI Customize

Add to Wishlist
Download
AI Customize

Add to Wishlist
Download
AI Customize

Add to Wishlist
Download
AI Customize

Add to Wishlist
Download
AI Customize


Add to Wishlist
Download
AI Customize


Add to Wishlist
Download
AI Customize

Add to Wishlist
Download
AI Customize
