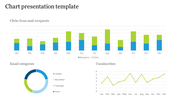
Dashboard PPT Template for Data Visualization Presentation

Dashboard slide with four speedometer graphics in purple gradients, each numbered and showing different pointer angles.
P.ID : 2584
    400 views
    16 Downloads
    Get Custom Slides by Experts
    Instantly Access Templates in PowerPoint

    Dashboard PowerPoint Template and Google Slides


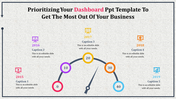
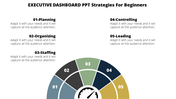
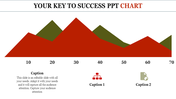
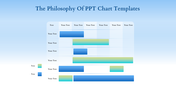
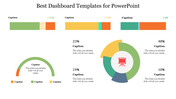
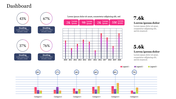
    The "Dashboard PPT Template and Google Slides" is a dynamic presentation template designed to visualize data and metrics effectively. Featuring four dashboard gauges, each with a distinct color scheme and set of numbers, this template is ideal for presenting key performance indicators (KPIs), metrics, and other quantitative information in a visually engaging manner. The slide is titled "Rules Not To Follow About Dashboard PPT Template," adding a touch of creativity and intrigue to your presentation.

    This template is suitable for professionals, analysts, managers, executives, and anyone tasked with presenting data-driven insights or performance metrics. Whether you're delivering a business report, conducting a performance review, or sharing project updates, this template empowers you to communicate complex information clearly and effectively.

    Compatibility with PowerPoint and Google Slides. Available in 16:9 and 4:3 aspect ratios, catering to different screen sizes and presentation preferences. Provided in ZIP format for easy sharing and distribution. 100% customizable features. Download now.
    Advertisement

    You May Also Like These PowerPoint Templates

    Add to Wishlist
    Download
    AI Customize
    Versatile PowerPoint Chart Templates for Data Insights
    Add to Wishlist
    Download
    AI Customize
    Horizontal bar chart with three color-coded series, labeled values, and a left side legend with numbered captions.
    Free
    Add to Wishlist
    Download
    AI Customize
    Circular gauge style infographic in shades of gray, showing a speedometer with a needle and distance markers.
    Add to Wishlist
    Download
    AI Customize
    Business executive dashboard template displaying project information, including date and editor with placeholder text.
    Add to Wishlist
    Download
    AI Customize
    Slide deck with multiple circular progress bars in various colors, showing percentages and captions below.
    Add to Wishlist
    Download
    AI Customize
    Slide with a horizontal bar chart on the left and 3D cylindrical percentage charts in blue, green, and teal, on the right.
    Add to Wishlist
    Download
    AI Customize
    Dashboard themed slide with a semi circular gauge showing four icons for speedometers and a central needle pointer.
    Add to Wishlist
    Download
    AI Customize
    Dashboard layout with gauges, bar charts, line graphs, and progress indicators for business performance metrics.
    Add to Wishlist
    Download
    AI Customize
    Green speedometer graphics illustrating performance levels at 70, 50, 55, and 85 percent in a PowerPoint template.
    Add to Wishlist
    Download
    AI Customize
    A tachometer graphic for PowerPoint, featuring different colored sections and text placeholders.
    Add to Wishlist
    Download
    AI Customize
    Four yellow speedometer graphics showing percentages of 70%, 50%, 55%, and 85% placed in a white background.
    Add to Wishlist
    Download
    AI Customize
    Dashboard PowerPoint template with progress bars, circular steps, and a multi color bar chart for tracking metrics.
    Add to Wishlist
    Download
    AI Customize
    Dashboard template showing last deposit, transaction, payment types, and data market percentages.
    Add to Wishlist
    Download
    AI Customize
    Colorful speedometer PPT slide with a gauge showing 25 percent and corresponding happy and sad faces with captions.
    Add to Wishlist
    Download
    AI Customize
    Logistics performance dashboard with two circular charts for failure distribution and delivery tracking, and a gauge meter.
    Add to Wishlist
    Download
    AI Customize
    Tachometer PPT slide with 4 colorful gauges in red, orange, green, and blue, each with caption sections on a white backdrop.
    Add to Wishlist
    Download
    AI Customize
    KPI dashboard slide with key metrics for business, development, and downloads, showing percentages with icons.