Create Pie Chart In PowerPoint Presentation Slide Template

PowerPoint slide showing a colorful pie chart with data and labels for sections A, B, and C with placeholder text.
P.ID : 65111
    166 views
    22 Downloads
    Get Custom Slides by Experts
    Instantly Access Templates in PowerPoint

    Pie Chart Presentation Slide

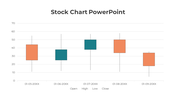
    If you're looking to present data clearly and concisely, look no further than the pie chart! This powerful tool is perfect for visualizing numerical proportions and making complex data easy to understand. With its simple yet effective design, the pie chart is a popular choice for business presentations and reports. It helps to convey information in a visually appealing way. And with our pie chart presentation template, you can represent your data in an understandable way for the audience.

    Features of the template

    • 100% customizable slides and easy to download.
    • Slides are available in different nodes & colors.
    • The slides contain 16:9 and 4:3 formats.
    • Easy to change the colors quickly.
    • It is a well-crafted template with an instant download facility.
    • It is a 100% pre-designed slide.
    • Highly compatible with PowerPoint and Google Slides"
    • It has an excellent pie chart to present your idea.
    Advertisement

    You May Also Like These PowerPoint Templates

    Add to Wishlist
    Download
    AI Customize
    Dashboard layout with income, expenses, profit, and cash flow figures on the left, a project budget chart in the center.
    Add to Wishlist
    Download
    AI Customize
    Dashboard template with pink charts showing facebook and twitter activity, percentage rings, and a page growth graph.
    Add to Wishlist
    Download
    AI Customize
    Line chart template with two lines and labeled data points, along with caption blocks on the left.
    Add to Wishlist
    Download
    AI Customize
    A green circular pie chart showing percentage, and four colored sales data graphs for different years.
    Add to Wishlist
    Download
    AI Customize
    A line graph showing a plot structure with key points marked by colored dots, representing key stages.
    Add to Wishlist
    Download
    AI Customize
    A donut chart with multiple segments in different colors next to a table displaying statistics and percentage changes.
    Free
    Add to Wishlist
    Download
    AI Customize
    Slide deck showcasing KWL chart layouts with colorful sections in purple, yellow, and teal, for structured insights.
    Add to Wishlist
    Download
    AI Customize
    Chart guide slide with two green-tone line graphs displaying data points, captions on the right, and a text footer.
    Add to Wishlist
    Download
    AI Customize
    KPI slide showcasing cash flow metrics and financial performance over six months in different bar chat layouts.
    Free
    Add to Wishlist
    Download
    AI Customize
    Comparison bar chart showing percentage values from 2011 to 2019 for chat and security categories.
    Add to Wishlist
    Download
    AI Customize
    A treasurer’s annual report slide featuring a bar chart and line graph in purple and blue with the title.
    Add to Wishlist
    Download
    AI Customize
    Infographic bar chart slide displaying daily comparisons for Business System and Supplier metrics.
    Add to Wishlist
    Download
    AI Customize
    Amazing Dashboard PowerPoint Template And Google Slides
    Add to Wishlist
    Download
    AI Customize
    Editable KPI Dashboard PowerPoint And Google Slides
    Add to Wishlist
    Download
    AI Customize
    Comparison chart with horizontal green bars displaying data for four examples across three series.
    Free
    Add to Wishlist
    Download
    AI Customize
    A slide showing a colorful KWL chart with sections for knowledge, inquiry, and learning outcomes with placeholder text.
    Free
    Add to Wishlist
    Download
    AI Customize
    Pie chart presentation slide showing three charts with percentages with text placeholders.
    Free
    Add to Wishlist
    Download
    AI Customize
    Six charts in different formats, including line, pie, bar, and gauge, all in blue and gray, displaying data trends.
    Free
    Add to Wishlist
    Download
    AI Customize
    Presentation slide layout illustrating key elements for high quality PowerPoint including steps with icons.