Editable Circular Progress Bar PPT And Google Slides

Pack of 11 slides
P.ID : 72520
Advertisement
791 views
238 Downloads
Get Custom Slides by Experts
Instantly Access Templates in PowerPoint

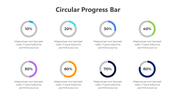
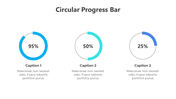
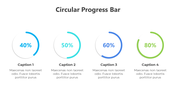
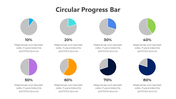
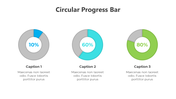
Circular Progress Bar Presentation Slides


Enhance your presentations with our versatile circular progress bar PPT and Google Slides templates, designed to bring a dynamic visual element to your data representation. Ideal for project managers, educators, and business professionals, these templates are perfect for showcasing progress, performance metrics, timelines, and milestones in a visually engaging manner. Our circular progress bar templates are meticulously crafted to ensure clarity and impact. Each slide features customizable circular progress bars that can be easily adjusted to reflect your specific data and progress percentages. These templates not only make your data visually appealing but also help in simplifying complex information, making it easier for your audience to understand and retain.

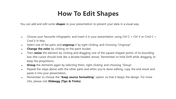
What sets our templates apart is their 100% editable and customizable features, allowing you to tailor every element to your specific needs and branding requirements. Whether you're tracking project completion, illustrating performance metrics, or highlighting key achievements, these templates provide the flexibility and functionality to deliver your message effectively. Elevate your presentations with our circular progress bar PPT and Google Slides templates. Make your data stand out, capture your audience's attention, and convey your progress with clarity and style. Take the first step towards more engaging presentations and download this presentation today!

Features of this templates


  • 100% customizable slides and easy to download.
  • The slide contains 16:9 and 4:3 formats.
  • Easy to change the colors of the slide quickly.
  • Highly compatible with PowerPoint and Google Slides.

You May Also Like These PowerPoint Templates

Add to Wishlist
Download
AI Customize
KPI dashboard showcasing private school growth with yellow bar charts indicating critical, low, none, and high levels.
Add to Wishlist
Download
AI Customize
A vertical green color bar chart slide displaying loss data from 2014 to 2019, with the title at the top.
Add to Wishlist
Download
AI Customize
Dashboard slide showing colour coded plant growth chart with progress ring visuals and percentages.
Add to Wishlist
Download
AI Customize
Dashboard slide showing sales bar chart with a highlighted value and a gauge representing business metrics.
Add to Wishlist
Download
AI Customize
A colorful pie chart diagram with concentric circles showing percentages for different data categories in 2021.
Add to Wishlist
Download
AI Customize
KPI dashboard layout with blue and green line graphs at the top and shaded bar charts at the bottom in gradient colors.
Free
Add to Wishlist
Download
AI Customize
Gantt chart slide showing six tasks with progress bars, each reflecting completion levels ranging from 30% to 80%.
Add to Wishlist
Download
AI Customize
Annual report slide with five sections of pie chart, bar graphs, and profit figures, in green and blue tones.
Add to Wishlist
Download
AI Customize
Four orange pie charts with center numbers from 01 to 04, each with text placeholders on the right.
Free
Add to Wishlist
Download
AI Customize
Line chart showing traction growth with two labeled data points in green and blue, alongside thumbs up and thumbs down icons.
Add to Wishlist
Download
AI Customize
Microsoft PowerPoint slide featuring three donut charts in yellow, orange, and pink, each with different percentage values.
Free
Add to Wishlist
Download
AI Customize
Line chart template with two data series on a dark background, featuring a calculator and pen in the background.
Add to Wishlist
Download
AI Customize
KPI Dashboard PPT slide displaying project analysis, revenue, profitability, and gap analysis with data visualizations.
Add to Wishlist
Download
AI Customize
Business KPI dashboard showcasing charts for real estate and page views with pie, bar, and line graph visualizations.
Add to Wishlist
Download
AI Customize
Colorful infographic with a line graph, pie and bar chart, and numerical data panels in a structured KPI template design.
Add to Wishlist
Download
AI Customize
Dashboard template showing sales, orders, visitors, and users metrics with visual bar and pie charts for website analysis.
Add to Wishlist
Download
AI Customize
Colorful progress bars in rows, showing numbered squares in red, teal, purple, and blue, with text on the right.
Add to Wishlist
Download
AI Customize
Professional setting with pie charts showing task distribution in red tones for analysis, collection, and development.
Add to Wishlist
Download
AI Customize
Slide featuring a blue-toned pie chart representing sales revenue percentages, with captions areas for each segment.
Add to Wishlist
Download
AI Customize
Row of pie charts with varying color schemes for data visualization each place diwth caption areas.
Add to Wishlist
Download
AI Customize
Dashboard chart displaying social media subscribers by gender, age, most read articles, and categories in 2019.
Add to Wishlist
Download
AI Customize
Three pie charts in red, yellow, and blue with percentage values, arranged horizontally with text below.
Add to Wishlist
Download
AI Customize
Chart showing blue bars representing growth metric alongside an orange line marking an ascending trend over eight categories.
Free
Add to Wishlist
Download
AI Customize
Line chart in teal showing data points from 2013 to 2020 on a white background, with five icons listed on the right.
Free
Add to Wishlist
Download
AI Customize
Histogram on the left and Pareto chart in pink and orange with cumulative line on the right.
Free
Add to Wishlist
Download
AI Customize
Dashboard with a timeline bar chart in green and purple, labeled with milestones for savings and investments.
Add to Wishlist
Download
AI Customize
Waterfall PowerPoint chart displaying increases and decreases for eight items with color coded bars for each change.
Add to Wishlist
Download
AI Customize
Horizontal bar graph slide with four colored steps and corresponding descriptions on the right.
Add to Wishlist
Download
AI Customize
Sales performance dashboard template in red displaying revenue, recent sales, user data, and session metrics visually.
Add to Wishlist
Download
AI Customize
Dashboard showing from defect rate trends upto delivery time analysis in mixed orange and brown theme.
Add to Wishlist
Download
AI Customize
KPI slide with four semi circular gauges displaying metrics and overlapping colored circles showing numerical data.
Add to Wishlist
Download
AI Customize
KPI dashboard layout with bar charts, a gauge, captions, and target metrics on light gray background, organized in sections.