Cool Pie Charts PPT Presentation Template Slide

Circular pie chart with four sections in yellow, red, purple, and blue, showing percentages and placeholder text.
P.ID : 65110
    238 views
    31 Downloads
    Get Custom Slides by Experts
    Instantly Access Templates in PowerPoint

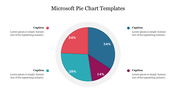
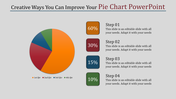
    Colorful Pie Chart With Four Nodes

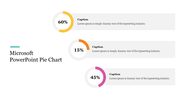
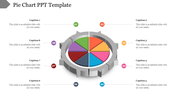
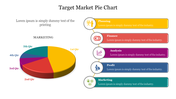
    Pie charts are the best tool to visually represent your data and compare the set of values. It will help you present the statistical report in a visually engaging manner. SlideEgg offers you this wonderful slide with eye-catching colors. It will help you hook your audience's attention and make your points across. Download it right now!

    About the template

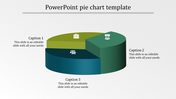
    It has a well-designed pie chart with four multicolor pies, showing different percentage values. It has a legend on the right side of the pie chart to present your notes. The cool colors used in this slide will make your presentation more attractive. It is also 100% editable, so it is possible to make a personalized presentation with your own data. We also offer SmartArt Pie Charts. Try Today!

    Features of the template

    • 100% customizable slides and easy to download.
    • Slides are available in different nodes & colors.
    • The slide contained 16:9 and 4:3 formats.
    • Easy to change the slide colors quickly.
    • Well-crafted template with instant download facility. 
    • Captivating pie chart slide.
    Advertisement

    You May Also Like These PowerPoint Templates

    Add to Wishlist
    Download
    AI Customize
    Pie chart slide showing budget distribution for facebook, google, and linkedIn ads with respective percentages.
    Add to Wishlist
    Download
    AI Customize
    Three pie charts in brown, blue, and green sections, each with labeled percentages and caption lines.
    Free
    Add to Wishlist
    Download
    AI Customize
    Multicolored circular pie chart in yellow, red, and green, with labeled categories listed on the right.
    Add to Wishlist
    Download
    AI Customize
    Annual report slide with a colorful chart representing yearly industry expenses, totaling 300K across various categories.
    Add to Wishlist
    Download
    AI Customize
    Chart maker slide with a 3D pie chart labeled for each quarter and four editable text boxes on the right side.
    Free
    Add to Wishlist
    Download
    AI Customize
    Circular green chart at the center divided into segments, with four rectangular text boxes, on a white background.
    Add to Wishlist
    Download
    AI Customize
    Four segmented doughnut charts in yellow, red, purple, and blue with black circular labels, percentage values, and captions.
    Free
    Add to Wishlist
    Download
    AI Customize
    Colorful pie chart slide showing five segments with percentages, paired with four content boxes for additional information.
    Add to Wishlist
    Download
    AI Customize
    Microsoft PowerPoint slide featuring three donut charts in yellow, orange, and pink, each with different percentage values.
    Add to Wishlist
    Download
    AI Customize
    Slide featuring a blue-toned pie chart representing sales revenue percentages, with captions areas for each segment.
    Add to Wishlist
    Download
    AI Customize
    Row of pie charts with varying color schemes for data visualization each place diwth caption areas.
    Add to Wishlist
    Download
    AI Customize
    Three pie charts in red, yellow, and blue with percentage values, arranged horizontally with text below.
    Free
    Add to Wishlist
    Download
    AI Customize
    A circular pie chart in blue and orange at the center, flanked by two rectangular sections with icons and text details.
    Add to Wishlist
    Download
    AI Customize
    Five segment pie chart in orange, blue, red, green, and pink, each with number and connected with text areas.
    Add to Wishlist
    Download
    AI Customize
    Colorful custom pie chart slide displaying three segments with percentages along with caption placeholders.
    Add to Wishlist
    Download
    AI Customize
    Three circular progress charts in red, teal, and yellow, with percentage levels, displayed on a black rectangular box.
    Add to Wishlist
    Download
    AI Customize
    Cute Pie Chart  Diagram PowerPoint Presentation Template