Pie Chart PowerPoint Template and Google Slides
Nodes
Colors
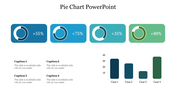
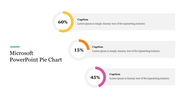
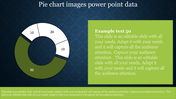
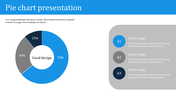
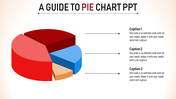
Pie Chart PowerPoint Template and Google Slides
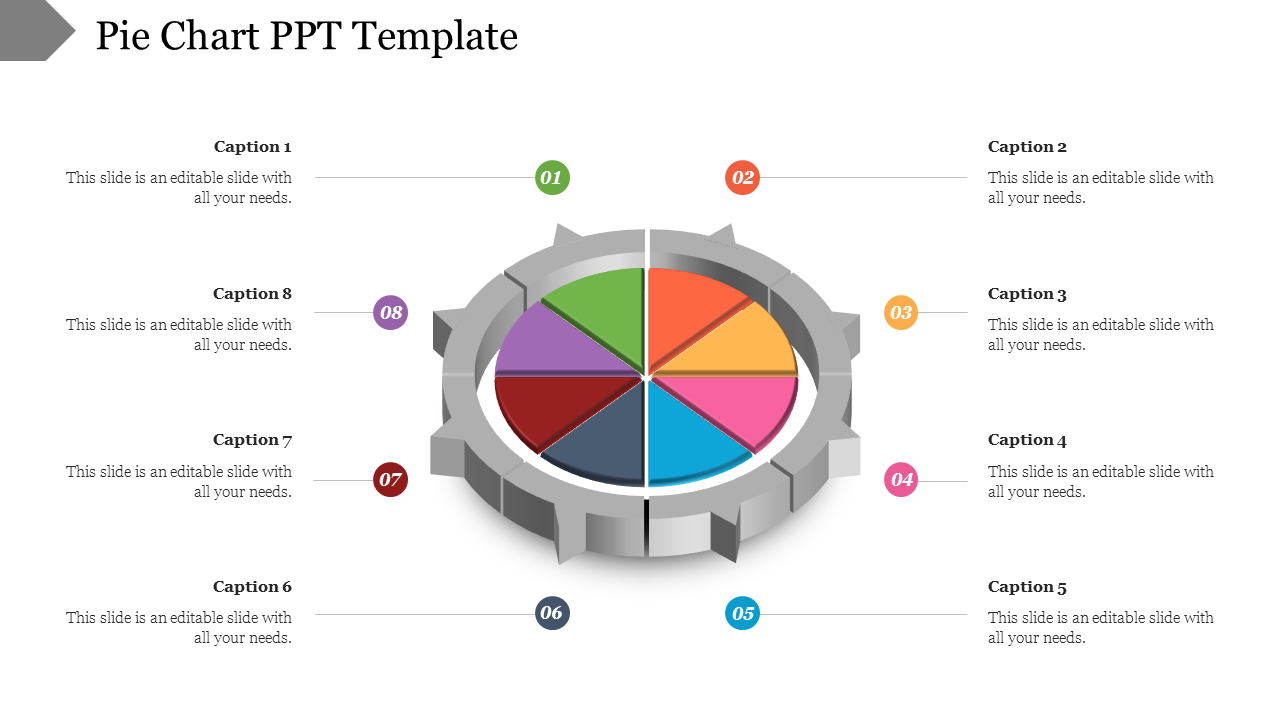
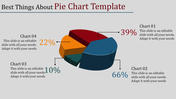
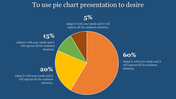
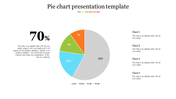
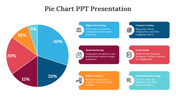
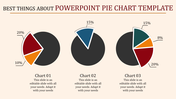
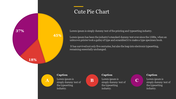
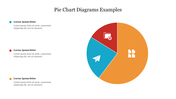
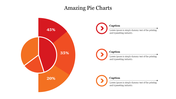
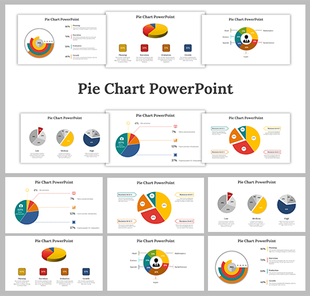
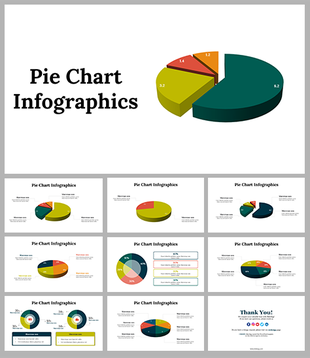
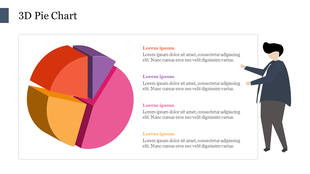
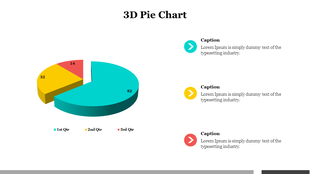
The "Pie Chart PPT Template and Google Slides" features a pie chart divided into eight sections, each with a different color and numbered caption. This template provides a visually appealing way to represent data distribution, percentages, or proportions in your presentations.
This template is useful for professionals, educators, analysts, and anyone who needs to present data in a visually engaging format. You can use this template whenever you need to illustrate data distribution or percentages in your presentations. It's ideal for financial reports, marketing presentations, research findings, project updates, and any other scenario where you want to convey information in a clear and visually compelling manner.
Compatible with PowerPoint and Google Slides, ensuring seamless integration into your presentation software. Available in "16:9" and "4:3" aspect ratios and zip formats to accommodate various presentation preferences and screen resolutions. It is free to download and fully customizable. Download the Pie Chart PPT Template and Google Slides now.
More Collections for Pie Chart PowerPoint Template and Google Slides
Recommended based on this template.
Similar Templates to Pie Chart PowerPoint Template and Google Slides

Showing20 of69,218 templates