3D Pie Chart PowerPoint Presentation Template

3D pie chart with blue, yellow, and red segments representing quarterly data, and corresponding captions on the right.
P.ID : 63803
    463 views
    74 Downloads
    Get Custom Slides by Experts
    Instantly Access Templates in PowerPoint

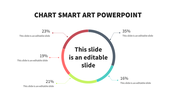
    Attractive 3D Pie Chart Template For Presentation


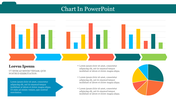
    SlideEgg has a fresh 3D Pie Chart template to represent the percentage. The infographic Pie Chart is a visual tool that can help you communicate critical metrics with your audience. The Chart is easily customizable and has unique features to make your information unique.


    About this template:


    Make your PowerPoint presentations look professional and eye-catching using the 3D Pie Chart template. It is designed using three unique nodes to illustrate your point. The template also holds a simple background theme, and it is easy to customize and add your own text and colors. In addition, you can download ready-to-use slides that match your theme from SlideEgg. 


    Feature of this template  


    • The Slides are available in different nodes & colors.
    • This slide contains 16:9 and 4:3 format.
    • It is easy to change the slide colors quickly.
    • It is a well-crafted template with an instant download facility.
    • The best PowerPoint theme template.
    • It is a well-designed presentation template.
    • Best design to represent data.

    Advertisement

    You May Also Like These PowerPoint Templates

    Free
    Add to Wishlist
    Download
    AI Customize
    Infographic PowerPoint slide with three bar charts showing weekly data with percentages for each day of the week.
    Add to Wishlist
    Download
    AI Customize
    Donut chart with alternating blue and black segments, labeled with percentages, and four icon based text boxes on the right.
    Add to Wishlist
    Download
    AI Customize
    Four 3D cone charts in red, blue, teal, and green with icons at the top, and labeled for different metrics.
    Add to Wishlist
    Download
    AI Customize
    PowerPoint slide featuring a circular chart infographic with sections for text.
    Add to Wishlist
    Download
    AI Customize
    Chart with four colored bars, each featuring an icon on the left and space for text, arranged in a vertical sequence.
    Add to Wishlist
    Download
    AI Customize
    Stunning Chart Infographics Template Free Download PPT
    Free
    Add to Wishlist
    Download
    AI Customize
    PowerPoint infographic with four colored pill shaped sections each labeled with placeholder text.
    Add to Wishlist
    Download
    AI Customize
    Chart infographic template with three progress bars in blue, red, and green accompanied by icons.
    Add to Wishlist
    Download
    AI Customize
    Chart infographic template with different chart types, including pie charts, bar charts, and a donut chart.
    Free
    Add to Wishlist
    Download
    AI Customize
    Infographic chart with four colorful blocks, each displaying a percentage, connected by a gray upward arrow.
    Add to Wishlist
    Download
    AI Customize
    Bubble Scatter PowerPoint Template With Three Nodes
    Add to Wishlist
    Download
    AI Customize
    Infographic slide with two colorful line charts from 2016 to 2019, on a blurred background of a tablet displaying data.
    Add to Wishlist
    Download
    AI Customize
    Download Unlimited Chart Template Presentation
    Add to Wishlist
    Download
    AI Customize
    Four distinct lines in blue, red, orange, and green on a line graph, with corresponding numbered captions beside.
    Add to Wishlist
    Download
    AI Customize
    Creative Asset Turnover PowerPoint Presentation PPT Slide
    Add to Wishlist
    Download
    AI Customize
    Line chart showcasing trends for two designs, labeled design 01 and 02, from 2015 to 2019.
    Add to Wishlist
    Download
    AI Customize
    A chart presentation slide with four circular progress indicators showing different percentages and corresponding captions.
    Add to Wishlist
    Download
    AI Customize
    Infographic showing four vertical 3D bars in different colors, each representing percentages with placeholder text area.
    Free
    Add to Wishlist
    Download
    AI Customize
    Data visualization slide showcasing an orange and black bubble chart with labeled axes and a text block on the side.