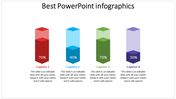
The Best PowerPoint Infographics Presentation Slides

 Canva
Canva
Powerful Ways to Create Better Business Infographic Presentations
You can create many different types of active and memorable Business Infographic Presentations. Business Graphic Designers is continually using various tools, techniques, and templates to present their customers with an exceptional presentation of their business through a medium such as an eBook or the web. Business Infographic Presentation is very exciting and can be an easy way to catch your customer's attention and interest. Here are some of the ways you can generate engaging Business Infographic Presentations.
One of the best PowerPoint Infographics you will ever create would be a history-based presentation on how you started up the business. In this presentation, you would have various pictures and all of the necessary details of how your company was started and how it grew over time. People will most likely be amazed by how you presented it, and that would give it a more significant impact in front of your audience.
Print business graphic designers can use several different techniques to make your presentation more effective. It can help if you decide which type of presentation you want to create. You need to create several different presentation styles and choose which one you want to present. There are plenty of methods available today, so you shouldn't have a problem finding one that fits you.
Choose a style that will fit the overall presentation. You should always remember that visual presentations have a better impact than written ones. Just like in a movie, people respond better to visuals. Also, you can add graphics and sound effects to your main points. Using an audio clip or video clip will create a "wow" factor, making your presentation even more useful. This is just one more way you can improve the overall effectiveness of your Business Infographic Presentation.
You can also use audio clips and videos to attract people's attention. A PowerPoint template is ready to use, and you can use it to create any type of presentation.
Whether you are presenting your business via a printed book or webinar, a business infographic presentation can help you captivate the audience's attention. Just be sure that you choose the best PowerPoint Infographics for your needs.


You May Also Like These PowerPoint Templates
Add to Wishlist
Download
AI Customize


Add to Wishlist
Download
AI Customize

Add to Wishlist
Download
AI Customize

Add to Wishlist
Download
AI Customize

Add to Wishlist
Download
AI Customize

Add to Wishlist
Download
AI Customize

Add to Wishlist
Download
AI Customize

Add to Wishlist
Download
AI Customize

Add to Wishlist
Download
AI Customize

Add to Wishlist
Download
AI Customize


Add to Wishlist
Download
AI Customize

Add to Wishlist
Download
AI Customize

Add to Wishlist
Download
AI Customize

Add to Wishlist
Download
AI Customize

Add to Wishlist
Download
AI Customize

Add to Wishlist
Download
AI Customize


