Mekko Chart Infographics PPT and Google Slides Themes

Pack of 36 slides
P.ID : 69783
Advertisement
179 views
33 Downloads
Get Custom Slides by Experts
Instantly Access Templates in PowerPoint

Mekko Chart Infographics PPT Slides

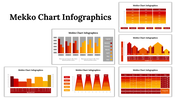
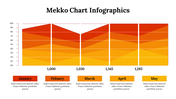
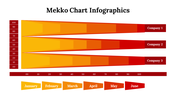
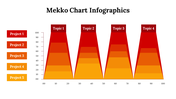
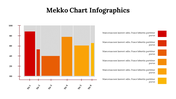
Graphs are no longer just graphs. Mekko has something unique and worthwhile for you. Give your data an artistic twist with this Mekko Chart PPT and Google Slides Themes. The “No Borders” style is a bit more whimsical, reminiscent of the rainbows and fairies of the legendary Marimekko prints.

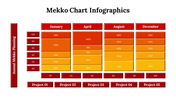
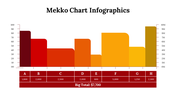
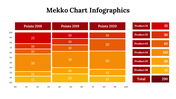
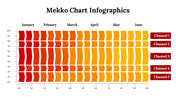
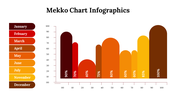
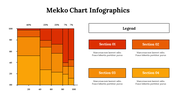
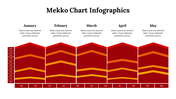
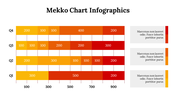
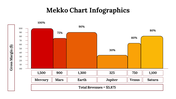
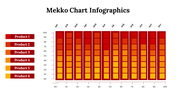
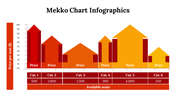
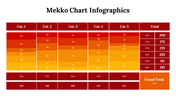
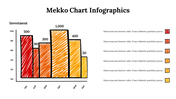
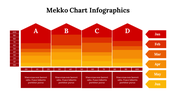
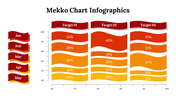
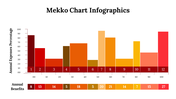
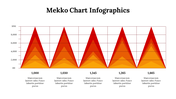
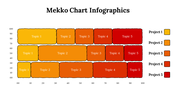
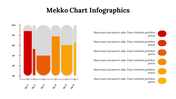
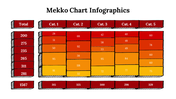
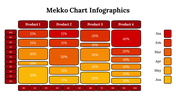
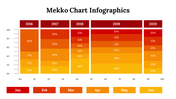
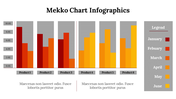
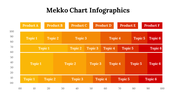
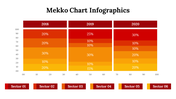
These charts are also known as Mekko charts or mosaic plots. A Mekko chart portrays absolute data using stacked bar graphs shaded differently to show variation among sets. These are the bundle of tiles that not just tells a story, but picture your data! It's time to evince your data uniquely with this pack of Mekkos! 

Features of the template

  • 100% customizable slides and easy to download.
  • Slides are available in different nodes & colors.
  • The slide contains 16:9 and 4:3 formats.
  • Easy to change the slide colors quickly.
  • Well-crafted template with an instant download facility.
  • Apt for Infographics data.

You May Also Like These PowerPoint Templates

Add to Wishlist
Download
AI Customize
PowerPoint slide featuring a circular chart infographic with sections for text.
Add to Wishlist
Download
AI Customize
Chart with four colored bars, each featuring an icon on the left and space for text, arranged in a vertical sequence.
Add to Wishlist
Download
AI Customize
Stunning Chart Infographics Template Free Download PPT
Free
Add to Wishlist
Download
AI Customize
PowerPoint infographic with four colored pill shaped sections each labeled with placeholder text.
Add to Wishlist
Download
AI Customize
Chart infographic template with three progress bars in blue, red, and green accompanied by icons.
Add to Wishlist
Download
AI Customize
Chart infographic template with different chart types, including pie charts, bar charts, and a donut chart.
Free
Add to Wishlist
Download
AI Customize
Infographic chart with four colorful blocks, each displaying a percentage, connected by a gray upward arrow.
Add to Wishlist
Download
AI Customize
Bubble Scatter PowerPoint Template With Three Nodes
Add to Wishlist
Download
AI Customize
Infographic slide with two colorful line charts from 2016 to 2019, on a blurred background of a tablet displaying data.
Add to Wishlist
Download
AI Customize
Download Unlimited Chart Template Presentation
Add to Wishlist
Download
AI Customize
Four distinct lines in blue, red, orange, and green on a line graph, with corresponding numbered captions beside.
Add to Wishlist
Download
AI Customize
Creative Asset Turnover PowerPoint Presentation PPT Slide
Add to Wishlist
Download
AI Customize
Line chart showcasing trends for two designs, labeled design 01 and 02, from 2015 to 2019.
Add to Wishlist
Download
AI Customize
A chart presentation slide with four circular progress indicators showing different percentages and corresponding captions.
Add to Wishlist
Download
AI Customize
Infographic showing four vertical 3D bars in different colors, each representing percentages with placeholder text area.
Free
Add to Wishlist
Download
AI Customize
Data visualization slide showcasing an orange and black bubble chart with labeled axes and a text block on the side.
Free
Add to Wishlist
Download
AI Customize
Wave shaped chart on a dark blue background with a detailed caption and numerical labels across the curve.
Add to Wishlist
Download
AI Customize
Horizontal bar chart with four colored bars in red, blue, purple, and pink, each labeled with a numerical value.
Add to Wishlist
Download
AI Customize
Slide showing a gray-shaded area graph with red circular markers and captions for three highlighted years.
Add to Wishlist
Download
AI Customize
Infographic PowerPoint slide with four blue bars of increasing height, each associated with a caption and placeholder text.
Add to Wishlist
Download
AI Customize
Circle chart PPT template displaying percentages in four sections with vibrant colors on a white backdrop with captions.
Add to Wishlist
Download
AI Customize
Colorful pie chart PPT template with four segments showing percentages and corresponding descriptions on the right.
Add to Wishlist
Download
AI Customize
Business PowerPoint slide displaying colorful pie charts with percent values, with text fields on a white backdrop.
Free
Add to Wishlist
Download
AI Customize
Color coded bar chart layout with sections in red, green, purple, and blue, each with labels and a central icon.
Add to Wishlist
Download
AI Customize
Business template bar graph with stacked segments for three captions, showing percentages per month from January to December.
Add to Wishlist
Download
AI Customize
Infographic with a four level bar chart in red, green, orange, and pink, paired with percentage labels and text boxes.
Add to Wishlist
Download
AI Customize
Colorful bar chart PowerPoint slide showing percentage based growth from 25 to 100 percent with placeholder text.
Add to Wishlist
Download
AI Customize
Mekko chart slides in red and yellow gradients, showcasing various data visualizations with bars and stacked charts.
Add to Wishlist
Download
AI Customize
Chart template with data visualization in teal bars, quote section with large quotation mark, and percentage highlight.
Add to Wishlist
Download
AI Customize
Slide with five circular pie charts in orange, green, blue, gray, and red, arranged dynamically, displaying a percentage.
Add to Wishlist
Download
AI Customize
KWL slide deck with various layouts, using purple, orange, and red, illustrating the learning process in a structured format.
Free
Add to Wishlist
Download
AI Customize
PPT Chart Infographics Free Download Design Slides
Add to Wishlist
Download
AI Customize
Colorful bar chart with five vertical bars in ascending order, each labeled with positive values and curved line above.
Add to Wishlist
Download
AI Customize
Slide with a stacked area chart in shades of pink, green, and yellow, and three matching circular data labels on the right.