PowerPoint Charts Template and Google Slides

 Canva
Canva

PowerPoint Charts Template and Google Slides
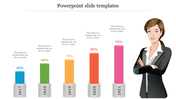
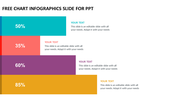
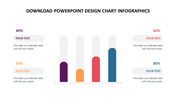
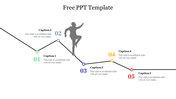
The "PowerPoint Charts Template and Google Slides" is a versatile tool designed to enhance data visualization in presentations. Featuring a graph chart with two distinct-colored lines representing different data sets, this template allows users to effectively illustrate trends, comparisons, and correlations. With years plotted on the x-axis and percentages on the y-axis, the template offers a comprehensive view of data over time, empowering presenters to convey complex information with clarity and precision.
This template is suitable for a wide range of presentation contexts where data analysis and visualization are essential. Whether you're delivering financial reports, market analyses, performance reviews, or project updates, the "PowerPoint Charts Template and Google Slides" provides a compelling visual framework to communicate key insights effectively.
Compatibility with PowerPoint and Google Slides. Available in 16:9 and 4:3 aspect ratios, catering to different screen sizes and presentation preferences. Provided in ZIP format for easy sharing and distribution. 100% customizable features. Download now.


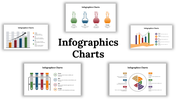
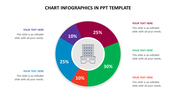
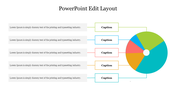
You May Also Like These PowerPoint Templates
Add to Wishlist
Download
AI Customize


Add to Wishlist
Download
AI Customize

Add to Wishlist
Download
AI Customize


Add to Wishlist
Download
AI Customize

Add to Wishlist
Download
AI Customize

Add to Wishlist
Download
AI Customize

Add to Wishlist
Download
AI Customize

Add to Wishlist
Download
AI Customize

Add to Wishlist
Download
AI Customize

Add to Wishlist
Download
AI Customize

Add to Wishlist
Download
AI Customize

Add to Wishlist
Download
AI Customize

Add to Wishlist
Download
AI Customize

Add to Wishlist
Download
AI Customize

Add to Wishlist
Download
AI Customize

Add to Wishlist
Download
AI Customize

Add to Wishlist
Download
AI Customize

Add to Wishlist
Download
AI Customize
