Chart PowerPoint Edit Layout Presentation Slide

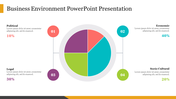
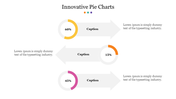
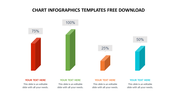
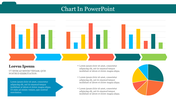
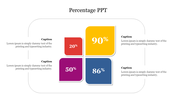
Chart PowerPoint Edit Layout Presentation Slide
Using the PowerPoint Edit Layout can be a great way to show financial goals and make your presentation look more professional. It is crafted using a variety of colors to highlight the information. The slices in the chart hold different percentages to showcase the data perfectly at a single glance.
About this template
The PowerPoint Edit Layout is a five-noded template. It is a colorful slide that you can use to create an attractive presentation. The slices will help you to compare percentages. In addition, the template is also 100 percent customizable. To download more creative chart templates, visit SlideEgg.
Feature of this template
- The Slides are available in different nodes & colors.
- This slide contains 16:9 and 4:3 format.
- It is easy to change the slide colors quickly.
- It is a well-crafted template with an instant download facility.
- The best PowerPoint theme template.
- It is a well-designed presentation template.


You May Also Like These PowerPoint Templates
Add to Wishlist
Download
AI Customize

Add to Wishlist
Download
AI Customize


Add to Wishlist
Download
AI Customize

Add to Wishlist
Download
AI Customize


Add to Wishlist
Download
AI Customize


Add to Wishlist
Download
AI Customize

Add to Wishlist
Download
AI Customize

Add to Wishlist
Download
AI Customize

Add to Wishlist
Download
AI Customize

Add to Wishlist
Download
AI Customize


Add to Wishlist
Download
AI Customize

Add to Wishlist
Download
AI Customize


Add to Wishlist
Download
AI Customize

Add to Wishlist
Download
AI Customize

Add to Wishlist
Download
AI Customize
