Free - Amazing Chart Infographics PPT Template Free Download

Free
Circular chart divided into ten multicolor wedges, with aligned legends sides featuring color bars and caption areas.
P.ID : 49716
    704 views
    310 Downloads
    Get Custom Slides by Experts
    Enhance Your Presentations with Add-ins
    Google Slides Add-in
    Access templates directly in Google Slides
    Microsoft PowerPoint Add-in
    Access templates directly in PowerPoint
    GPT Add-on
    AI-powered presentation assistance

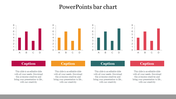
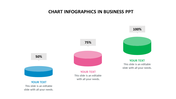
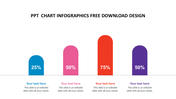
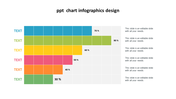
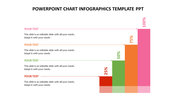
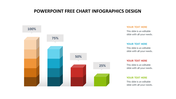
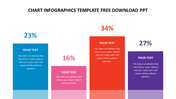
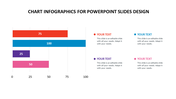
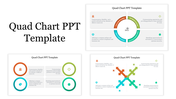
    Amazing chart infographics ppt template


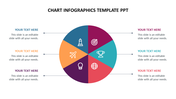
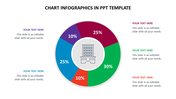
    Try out this chart infographics ppt template and make your presentation a success. This free template is added with a circular design with small icons. The user can use the spin wheel design used in the template for showing the target in the presentation. This chart infographics can be used for your business presentation as well. Use the fully customized feature to make your presentation a resounding success. Try using these user-friendly features and gain success.

    Feature of the Template

    • 100% customizable slides
    • Easy to change the slide colors quickly.
    • It is easy to download.
    • Slides are available in different nodes & colors.
    • The slide contained 16:9 and 4:3 formats.
    • Well-crafted template with instant download facility.
    • Highly compatible with PowerPoint, Google Slides, and Canva Presentation.
    Advertisement

    You May Also Like These PowerPoint Templates

    Add to Wishlist
    Download
    AI Customize
    Mekko chart slides in red and yellow gradients, showcasing various data visualizations with bars and stacked charts.
    Add to Wishlist
    Download
    AI Customize
    Chart template with data visualization in teal bars, quote section with large quotation mark, and percentage highlight.
    Add to Wishlist
    Download
    AI Customize
    Slide with five circular pie charts in orange, green, blue, gray, and red, arranged dynamically, displaying a percentage.
    Add to Wishlist
    Download
    AI Customize
    KWL slide deck with various layouts, using purple, orange, and red, illustrating the learning process in a structured format.
    Free
    Add to Wishlist
    Download
    AI Customize
    Colorful bar chart with four upward columns in varying heights and values, each paired with a caption section.
    Add to Wishlist
    Download
    AI Customize
    Colorful bar chart with five vertical bars in ascending order, each labeled with positive values and curved line above.
    Add to Wishlist
    Download
    AI Customize
    Slide with a stacked area chart in shades of pink, green, and yellow, and three matching circular data labels on the right.
    Add to Wishlist
    Download
    AI Customize
    Triangular chart with overlapping colored sections labeled 30% to 100%, each linked to captions areas below.
    Add to Wishlist
    Download
    AI Customize
    Infographic slide with colorful 3D-style bar charts labeled by percentage and matching text descriptions on the right.
    Add to Wishlist
    Download
    AI Customize
    Four colored bar charts in red, yellow, green, and orange, each with captions below, displayed on a white background.
    Free
    Add to Wishlist
    Download
    AI Customize
    Donut chart template with four segments representing different quarters with placeholder text.
    Free
    Add to Wishlist
    Download
    AI Customize
    Gantt chart with green horizontal bars representing tasks and percentages, spanning from January to December 2019.
    Add to Wishlist
    Download
    AI Customize
    3D bar chart with four colorful stacked columns in orange, blue, red, and green, each labeled with a percentage value.
    Add to Wishlist
    Download
    AI Customize
    Slide deck preview with engagement metrics visuals including comparisons, analytics, and performance data in vibrant colors.
    Add to Wishlist
    Download
    AI Customize
    Chart visualization slide with a circular pie chart and a horizontal bar graph for team member progress on tasks.
    Free
    Add to Wishlist
    Download
    AI Customize
    Colorful infographic with four rectangular bars labeled 20%, 50%, 30%, and 20%, each with matching color coded captions.
    Add to Wishlist
    Download
    AI Customize
    Bar chart showing percentages from 2017 to 2021, with bars in blue, green, orange, red, and pink, and a woman illustration.
    Free
    Add to Wishlist
    Download
    AI Customize
    Business infographic PPT chart with colorful horizontal bar segments with placeholder text on a white backdrop.