Simple Chart Infographics Template PPT Presentation Slides


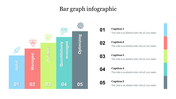
Simple Chart Infographics Template PPT
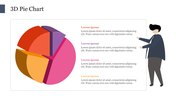
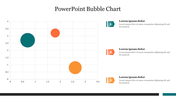
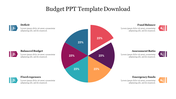
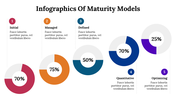
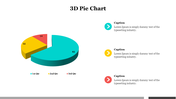
Pie charts are the type of graph that represents the data in the circular graph. They are circular statistical graphics divided into slices to illustrate numerical proportion. Create your circular infographics presentations with our Simple Chart Infographics Template PPT.
It is one of the charming Chart Infographics templates from SlideEgg. This is a four nodded template. It has a clipart of pic chart diagram with four partitions. They are contrasted with the vibrant shades of yellow, blue, green, and indigo. Grab now!!!
Features of the template:
- 100% customizable slides and easy to download.
- Slides are available in different nodes & colors.
- The slide contained 16:9 and 4:3 formats.
- Easy to change the slide colors quickly.
- Well-crafted template with instant download facility.
- Fantastic four-nodes featured template.


You May Also Like These PowerPoint Templates
Add to Wishlist
Download
Edit

Add to Wishlist
Download
Edit

Add to Wishlist
Download
Edit

Add to Wishlist
Download
Edit

Add to Wishlist
Download
Edit

Add to Wishlist
Download
Edit

Add to Wishlist
Download
Edit


Add to Wishlist
Download
Edit


Add to Wishlist
Download
Edit

Free
Add to Wishlist
Download
Edit

Add to Wishlist
Download
Edit


Add to Wishlist
Download
Edit

Add to Wishlist
Download
Edit

Add to Wishlist
Download
Edit

Add to Wishlist
Download
Edit

Add to Wishlist
Download
Edit

Add to Wishlist
Download
Edit
