Practical Metric Chart PowerPoint Presentation Template

Practical Metric Chart PowerPoint Presentation Template
P.ID : 57045
    278 views
    17 Downloads
    Get Custom Slides by Experts
    Instantly Access Templates in PowerPoint

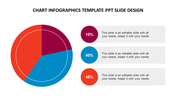
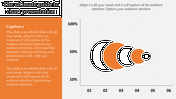
    Effective Metric Chart Template With Three Nodes

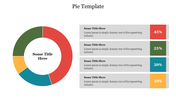
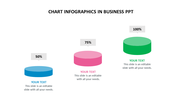
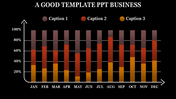
    Suppose you want to present your data or information in a Chart. It may look hard, but you want to present the points in a chart. Then get our Metric Chart PPT PowerPoint Template to make a better presentation. In addition, This Metric Chart template is utilized in a business meeting or company meeting. It has three Points with a percentage level in the purple chart with captions. For each caption, users can add text. Our templates are compatible with Google slides. This Metric Chart PPT PowerPoint Template is 100% editable. In addition, Users can edit the chart colors and text in this template. Our users can choose any slide from the chart PowerPoint Templates. 

    Features of this template

    • 100% Customizable (shape color, size & text)
    • This template has a chart, and you can also choose the color
    • Drag and drop image placeholder
    • Huge Collections of chart slides to impress your audience
    • It supports an aspect ratio of 16:9 and 4:3 format
    • Easily readable and acceptable template.
    Advertisement

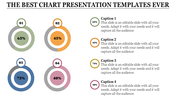
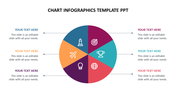
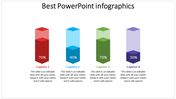
    You May Also Like These PowerPoint Templates

    Add to Wishlist
    Download
    AI Customize
    Mekko chart slides in red and yellow gradients, showcasing various data visualizations with bars and stacked charts.
    Add to Wishlist
    Download
    AI Customize
    Chart template with data visualization in teal bars, quote section with large quotation mark, and percentage highlight.
    Free
    Add to Wishlist
    Download
    AI Customize
    Bar chart with five purple cylinders and percentages arranged from left to right, next to a professional woman in a suit.
    Add to Wishlist
    Download
    AI Customize
    Slide with five circular pie charts in orange, green, blue, gray, and red, arranged dynamically, displaying a percentage.
    Add to Wishlist
    Download
    AI Customize
    KWL slide deck with various layouts, using purple, orange, and red, illustrating the learning process in a structured format.
    Free
    Add to Wishlist
    Download
    AI Customize
    PPT Chart Infographics Free Download Design Slides
    Add to Wishlist
    Download
    AI Customize
    Colorful bar chart with five vertical bars in ascending order, each labeled with positive values and curved line above.
    Add to Wishlist
    Download
    AI Customize
    Slide with a stacked area chart in shades of pink, green, and yellow, and three matching circular data labels on the right.
    Add to Wishlist
    Download
    AI Customize
    Triangular chart with overlapping colored sections labeled 30% to 100%, each linked to captions areas below.
    Add to Wishlist
    Download
    AI Customize
    Best Business PowerPoint Chart Infographics Slide
    Add to Wishlist
    Download
    AI Customize
    Four colored bar charts in red, yellow, green, and orange, each with captions below, displayed on a white background.
    Free
    Add to Wishlist
    Download
    AI Customize
    Donut chart template with four segments representing different quarters with placeholder text.
    Free
    Add to Wishlist
    Download
    AI Customize
    Gantt chart with green horizontal bars representing tasks and percentages, spanning from January to December 2019.
    Add to Wishlist
    Download
    AI Customize
    3D bar chart with four colorful stacked columns in orange, blue, red, and green, each labeled with a percentage value.
    Add to Wishlist
    Download
    AI Customize
    Boost Engagement Rate PowerPoint and Google Slides Themes
    Add to Wishlist
    Download
    AI Customize
    Chart visualization slide with a circular pie chart and a horizontal bar graph for team member progress on tasks.
    Free
    Add to Wishlist
    Download
    AI Customize
    Attractive PowerPoint Templates Chart Infographics Design
    Add to Wishlist
    Download
    AI Customize
    Bar chart showing percentages from 2017 to 2021, with bars in blue, green, orange, red, and pink, and a woman illustration.