Free - Amazing PPT and Google Slides Charts Template Presentation
Free

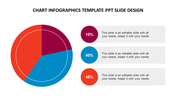
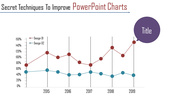
PowerPoint Charts Template
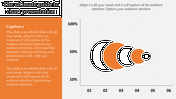
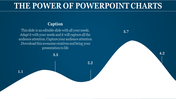
Searching for a template to showcase the approximate details in a graphical map? Our PowerPoint Charts Template can help with that. The slide is designed to revolutionize your data presentations with precision. The centerpiece of this template features a curved chart showcasing values in both elevated and declined formats. Each curve is thoughtfully designed to represent numerical data with decimal precision.
It further offers an engaging way to convey complex information. Apt for financial analysts, data scientists and business strategists. A suitable template for illustrating revenue growth, data analysis meetings, strategic planning sessions, showcasing market fluctuations or presenting statistical data. Download the template to ensure your audience grasps the intricacies of your numerical insights.
Features of the template
- The slide contains 16:9 and 4:3 formats.
- Compatible with Google slide themes and PowerPoint.
- 100% customizable slides and free to download.
- It is easy to change the colors of the slide quickly.
- Well-crafted template with an instant download facility.


You May Also Like These PowerPoint Templates
Add to Wishlist
Download
Edit

Add to Wishlist
Download
Edit

Add to Wishlist
Download
Edit

Add to Wishlist
Download
Edit


Add to Wishlist
Download
Edit

Add to Wishlist
Download

Add to Wishlist
Download
Edit

Add to Wishlist
Download
Edit

Add to Wishlist
Download
Edit

Add to Wishlist
Download

Add to Wishlist
Download
Edit

Add to Wishlist
Download
Edit

Add to Wishlist
Download
Edit


Add to Wishlist
Download
Edit

Add to Wishlist
Download
Edit

Add to Wishlist
Download
Edit

Add to Wishlist
Download
Edit

Add to Wishlist
Download
Edit
