Chart Model Area Graph Presentation Template Designs

Slide showing a gray-shaded area graph with red circular markers and captions for three highlighted years.
P.ID : 11382
    438 views
    15 Downloads
    Get Custom Slides by Experts
    Instantly Access Templates in PowerPoint

    Area Graph Design Templates and Google Slides

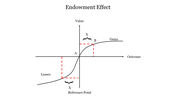
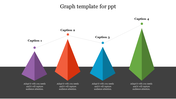
    Immerse your audience in a visual journey with our captivating area graph PPT template. Crafted with meticulous attention to detail, our graph model design elegantly showcases eight nodes of data, each telling a unique story of your business landscape. With professional shades and colors expertly curated to resonate with your brand identity, our presentation breathes life into your insights, making them not just comprehensible but unforgettable. Whether you're unveiling quarterly trends or mapping market fluctuations, our area graph presentation transforms raw data into a compelling narrative, captivating hearts and minds alike. Let your story unfold seamlessly as you navigate through peaks and valleys, guiding your audience to a deeper understanding of your vision. Elevate your presentations from mundane to memorable with our innovative approach to data visualization. Dive into the realm of possibilities and create an experience that leaves a lasting impression.

    Features of the template

    • 100% customizable slides and easy to download.
    • Slides are available in different nodes & colors.
    • The slide contains 16:9 and 4:3 formats.
    • Easy to change the colors of the slide quickly.
    • Well-crafted template with an instant download facility.
    Advertisement

    You May Also Like These PowerPoint Templates

    Add to Wishlist
    Download
    AI Customize
    A collection of story arc slides featuring graphs illustrating rising action, climax, and resolution points for storytelling.
    Add to Wishlist
    Download
    AI Customize
    An S shaped curve graph with three key points, illustrating growth or change over time with captions.
    Add to Wishlist
    Download
    AI Customize
    Positively skewed histogram with blue bars, three highlighted data points, and a centered orange button at the bottom.
    Add to Wishlist
    Download
    AI Customize
    A bell curve chart slide with an orange shaded area representing percentages for standard deviations.
    Add to Wishlist
    Download
    AI Customize
    A four quadrant graph with colorful sections labeled from 01 to 04 in the center. Each quadrant has placeholder text area.
    Add to Wishlist
    Download
    AI Customize
    Graph representation of the Dunning Kruger effect, mapping confidence levels from know nothing to expert across four stages.
    Add to Wishlist
    Download
    AI Customize
    Editable Kano Model PowerPoint and Google Slides Themes
    Add to Wishlist
    Download
    AI Customize
    Bradley curve chart with four sections in shades of maroon, and orange, illustrating progression through stages.
    Add to Wishlist
    Download
    AI Customize
    A chart with a bell curve divided into five colored sections illustrating market segments with percentages.
    Add to Wishlist
    Download
    AI Customize
    Graphical representation of a story arc showing stages from exposition to resolution, with labeled points for each action.
    Add to Wishlist
    Download
    AI Customize
    Collection of plot diagram templates showing rising action, climax, and resolution in a line graph style.
    Add to Wishlist
    Download
    AI Customize
    Line graph template with two lines showing data across seven items, with percentage icons and captions below.
    Add to Wishlist
    Download
    AI Customize
    Conflict management slide with a slope line graph marking stages in four colored arrows, ending in a yellow star.
    Add to Wishlist
    Download
    AI Customize
    Spider graph displaying data from 2018 to 2023 with two data sets highlighted in orange and pink lines.
    Add to Wishlist
    Download
    AI Customize
    Slide deck showing the Kubler Ross change curve with colorful dots on a line graph illustrating emotional stages over time.
    Add to Wishlist
    Download
    AI Customize
    Graph showing a positively skewed distribution, with a longer tail extending to the right, indicating more high values.
    Add to Wishlist
    Download
    AI Customize
    Kano model analysis graph illustrating delighters, satisfiers, and basic features with curved lines and caption areas.
    Add to Wishlist
    Download
    AI Customize
    Progress bar slide with colored bars representing market, business, timeline, and goal categories with percentages.