Line Story Arc Examples Presentation PowerPoint Slide

Graphical representation of a story arc showing stages from exposition to resolution, with labeled points for each action.
P.ID : 61175
    308 views
    14 Downloads
    Get Custom Slides by Experts
    Instantly Access Templates in PowerPoint

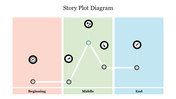
    Story Arc Examples Presentation Slide

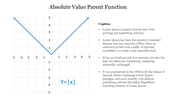
    Understanding the story arc is crucial for creating compelling stories that resonate with your audience. In this presentation, we'll explore different story arc examples and how they can be used to create engaging narratives. Our Story Arc Examples template provides a simple and effective way to visualize the elements of a story arc, making it easier to craft powerful stories. Whether you're a writer, marketer, or content creator, this template can help you create impactful presentations that captivate your audience.


    Features of the template:

    • 100% customizable slide and easy to download. 
    • The slide contained in 16:9 and 4:3 formats.
    • This slide has a colorful design pattern.
    • Highly compatible with PowerPoint and Google Slides.
    • Drag and drop image placeholder.
    • Well-crafted template with instant download facility.
    • One of the best-graph templates from SlideEgg.
    • Suitable template for narrative story building.
    Advertisement

    You May Also Like These PowerPoint Templates

    Add to Wishlist
    Download
    AI Customize
    Graph illustrating the yearly findings of how to find PowerPoint templates from 2016 to 2023 with two data series.
    Free
    Add to Wishlist
    Download
    AI Customize
    Slide with green radar chart, satellite dish on the right, and two labeled statistical hexagonal sections below.
    Add to Wishlist
    Download
    AI Customize
    Line graph representing the Kubler Ross Model with seven emotional stages marked by colored points on a curve.
    Free
    Add to Wishlist
    Download
    AI Customize
    Weekly bar chart with green bars showing Style 1 to Style 4 timelines, accompanied by a tilted yellow note box.
    Add to Wishlist
    Download
    AI Customize
    Line graph displaying trends across four categories with three distinct colored lines and percentage highlights below.
    Add to Wishlist
    Download
    AI Customize
    PowerPoint slide showing a quick fact about music's impact, with a graph displaying intelligence levels and famous composers.
    Add to Wishlist
    Download
    AI Customize
    PowerPoint template showing a line graph with three products A, B, and C plotted over time from 2015 to 2019.
    Free
    Add to Wishlist
    Download
    AI Customize
    Slide with a sloping bar graph in green and gray segments, three numbered points, and a text box on the right.
    Add to Wishlist
    Download
    AI Customize
    Two vertical bar charts with three columns each, alongside captions with percentages in varying shades of orange.
    Free
    Add to Wishlist
    Download
    AI Customize
    Revenue analysis slide with bar chart, financial icon, and two descriptive sections for customer metrics.
    Free
    Add to Wishlist
    Download
    AI Customize
    3D bar graph with six green bars of varying heights, labeled placeholders, and a gray sidebar with text blocks.
    Free
    Add to Wishlist
    Download
    AI Customize
    Visual layout of various charts, including area and bar graphs, arranged in a grid format with caption areas.
    Free
    Add to Wishlist
    Download
    AI Customize
    Comparison of revenue and cost distributions with pie charts displaying CAPEX and OPEX percentages.
    Add to Wishlist
    Download
    AI Customize
    Slide showing a graph of the Dunning-Kruger Effect with stages from knowing nothing to becoming an expert with a title text.
    Add to Wishlist
    Download
    AI Customize
    Narrative arc slide displaying key plot stages with placeholder text areas.
    Add to Wishlist
    Download
    AI Customize
    Line graph slide with two data series in red and yellow, showing item based data fluctuations and a text caption.
    Add to Wishlist
    Download
    AI Customize
    Graph showing an upward curve with captions along key points, indicating growth or improvement over time.