Editable Graph PPT Template & Google Slides for Presentation

Bar graph with six categories and three data series, featuring two informational sections at the top with placeholder text.
P.ID : 63988
    621 views
    79 Downloads
    Get Custom Slides by Experts
    Instantly Access Templates in PowerPoint

    Effective editable Graph template

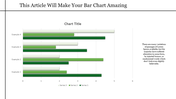
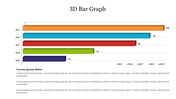
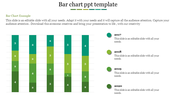
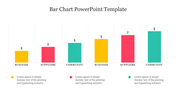
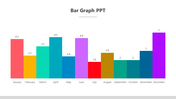
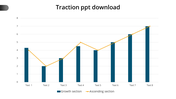
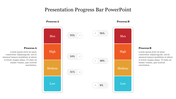
    An editable Graph PowerPoint template is a beautiful template that you can use for your effective graph design template. The template is given with vibrant shades of blue, which you can differentiate in each node.


    The template has six nodes that can make the best outcome. the template is used for graph presentation for your customer service and other service meetings. You can use the template for marketing, sales, and other business-related presentations.


    The template is fully customized, so editing and downloading this template is more effortless. The temperature is user-friendly and can be downloaded into any device and presented using any device. Make sure to download 100 percent satisfactory templates and gain the audience's attention. Try now!.

    Features of this template

    • This template is 100% editable.
    • 100% Customizable (shape color, size & text)
    • It supports an aspect ratio of 16:9.
    • Easily readable and acceptable template.
    • Creative design with vibrant colors.
    • Text area with six nodes.
    Advertisement

    You May Also Like These PowerPoint Templates

    Add to Wishlist
    Download
    AI Customize
    Chart slide showing market supply data from 2004 to 2014 with red bars and percentage annotations.
    Free
    Add to Wishlist
    Download
    AI Customize
    3D bar chart PowerPoint template showcasing data in four colored categories with a highlight and captions.
    Free
    Add to Wishlist
    Download
    AI Customize
    Horizontal chart with dual color bars in green and blue, displaying percentage values, and two captions on the right.
    Add to Wishlist
    Download
    AI Customize
    Slide with a vertical bar chart and four labeled sections, each paired with a unique color and icon.
    Free
    Add to Wishlist
    Download
    AI Customize
    A blue themed slide featuring a multi year bar chart comparison from 2016 to 2021 with three placeholders below.
    Free
    Add to Wishlist
    Download
    AI Customize
    3D chart with five colored bars in gold, red, green, teal, and orange, on individual bases, displaying percentages above.
    Add to Wishlist
    Download
    AI Customize
    Graph with teal and gray bars for project budget, along with expenditure icons and amounts displayed on the right.
    Add to Wishlist
    Download
    AI Customize
    Innovative 3D Progress Bar PowerPoint And Google Slides
    Add to Wishlist
    Download
    AI Customize
    Editable PowerPoint Chart Templates For Presentation
    Add to Wishlist
    Download
    AI Customize
    PowerPoint slide with a bar chart showing data for 2017, 2018, 2019, and 2020 in colorful bars.
    Add to Wishlist
    Download
    AI Customize
    PowerPoint chart template showing stacked bar graphs with different categories and values for each year from 2016 to 2019.
    Add to Wishlist
    Download
    AI Customize
    Bar chart with two sections in orange and green, with captions and numerical values under each.
    Add to Wishlist
    Download
    AI Customize
    Bar chart slide showcasing yearly data from 2016 to 2021, with three distinct bar categories and values in shades of purple.
    Add to Wishlist
    Download
    AI Customize
    Slide featuring a 3D bar graph with three series on dark backdrop, a green star shaped badge, and text boxes below.
    Add to Wishlist
    Download
    AI Customize
    PowerPoint bar chart design slide featuring various colored flags and labeled categories at the bottom.
    Add to Wishlist
    Download
    AI Customize
    Simple Bar Chart Layout PowerPoint Presentation