Creative Bar Chart PPT Template Presentation

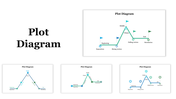
Bar Chart Presentation Template
Supercharge your presentations with our cool Bar Chart Presentation Template! Imagine it like a superhero cape for your data. It's like a puzzle where you get to customize the pieces – change the captions, add your cool content, and watch your information come to life!
This template is your secret weapon for sharing info in a way that's easy to understand, like telling a story with pictures. Great for big thinkers, numbers wizards, and presentation heroes. Whether you're talking about superhero sales, magic market trends, or financial adventures, our Bar Chart template is your trusty sidekick.
Upgrade your presentations to superhero status! Download our Bar Chart Presentation Template now and let your data shine like never before. Because in the world of presentations, being a superhero is super fun!
Features of the Template
- 100 % customizable slides.
- The slide show is in 4:3, 16:9, zip format.
- There is powerful connectivity with PowerPoint Templates.
- It is simple and quick to alter the slide's color.
- An efficient template that can be easily accessed immediately.
- Well-crafted template with an instant download facility.


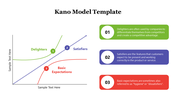
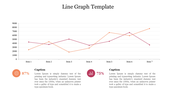
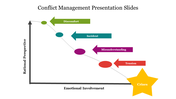
You May Also Like These PowerPoint Templates
Add to Wishlist
Download
Edit

Add to Wishlist
Download
Edit

Add to Wishlist
Download
Edit

Add to Wishlist
Download
Edit

Add to Wishlist
Download
Edit

Add to Wishlist
Download
Edit

Add to Wishlist
Download
Edit

Add to Wishlist
Download
Edit

Add to Wishlist
Download
Edit

Add to Wishlist
Download
Edit

Add to Wishlist
Download
Edit

Add to Wishlist
Download
Edit

Add to Wishlist
Download
Edit

Add to Wishlist
Download
Edit

Add to Wishlist
Download
Edit

Add to Wishlist
Download
Edit

Add to Wishlist
Download
Edit

Add to Wishlist
Download
Edit


Add to Wishlist
Download
Edit
