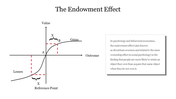
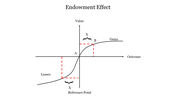
The Endowment Effect PowerPoint Template & Google Slides

Endowment effect graph depicting reference points, gains, losses, and a description explaining ownership bias in psychology.
P.ID : 61255
    170 views
    8 Downloads
    Get Custom Slides by Experts
    Instantly Access Templates in PowerPoint

    Impressive Nursing PPT Presentation Ideas Slides


    Download this effective Nursing Presentation Ideas PowerPoint template for making some wonderful presentation slides on nursing. This Nursing Presentation Ideas PowerPoint template comes with a cartoon image of a nurse at the center part of the template. This impressive PowerPoint presentation template comes with three stunning nodes and a huge rectangular node through which you can enter some of the qualities of a nurse. 

    This type of PowerPoint presentation template is highly customizable and easily editable and so it will save your most valuable time and resources to a very large extent.

    Features of this template:

    • 100% customizable slides and easy to download. 
    • Slides available in different nodes and colors. 
    • The slide contained 16:9 and 4:3 format.
    • Easy to change the slide colors quickly. 
    • It is a well-crafted template with an instant download facility. 
    • Saves time.
    • Easy accessible and user-friendly.
    Advertisement

    You May Also Like These PowerPoint Templates

    Add to Wishlist
    Download
    AI Customize
    Infographic PowerPoint slide with four blue bars of increasing height, each associated with a caption and placeholder text.
    Add to Wishlist
    Download
    AI Customize
    Graph illustrating the yearly findings of how to find PowerPoint templates from 2016 to 2023 with two data series.
    Free
    Add to Wishlist
    Download
    AI Customize
    Slide with green radar chart, satellite dish on the right, and two labeled statistical hexagonal sections below.
    Add to Wishlist
    Download
    AI Customize
    Line graph representing the Kubler Ross Model with seven emotional stages marked by colored points on a curve.
    Add to Wishlist
    Download
    AI Customize
    PowerPoint slide showing a quick fact about music's impact, with a graph displaying intelligence levels and famous composers.
    Free
    Add to Wishlist
    Download
    AI Customize
    Slide with a sloping bar graph in green and gray segments, three numbered points, and a text box on the right.
    Add to Wishlist
    Download
    AI Customize
    Slide showing a graph of the Dunning-Kruger Effect with stages from knowing nothing to becoming an expert with a title text.
    Add to Wishlist
    Download
    AI Customize
    Narrative arc slide displaying key plot stages with placeholder text areas.
    Add to Wishlist
    Download
    AI Customize
    Line graph slide with two data series in red and yellow, showing item based data fluctuations and a text caption.
    Add to Wishlist
    Download
    AI Customize
    Graph showing an upward curve with captions along key points, indicating growth or improvement over time.
    Add to Wishlist
    Download
    AI Customize
    A curve graph with two lines in teal and black and six labeled points, with corresponding captions on the right.
    Add to Wishlist
    Download
    AI Customize
    A collection of story arc slides featuring graphs illustrating rising action, climax, and resolution points for storytelling.
    Add to Wishlist
    Download
    AI Customize
    An S shaped curve graph with three key points, illustrating growth or change over time with captions.
    Add to Wishlist
    Download
    AI Customize
    Positively skewed histogram with blue bars, three highlighted data points, and a centered orange button at the bottom.
    Add to Wishlist
    Download
    AI Customize
    A bell curve chart slide with an orange shaded area representing percentages for standard deviations.
    Add to Wishlist
    Download
    AI Customize
    A four quadrant graph with colorful sections labeled from 01 to 04 in the center. Each quadrant has placeholder text area.
    Add to Wishlist
    Download
    AI Customize
    Graph representation of the Dunning Kruger effect, mapping confidence levels from know nothing to expert across four stages.