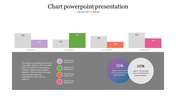
Stunning Revenue Graph PowerPoint Presentation Slide

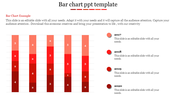
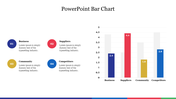
Attractive Six Noded Revenue Growth Graph PPT Slide
Download this Revenue Graph PowerPoint Template from SlideEgg to make a powerful business presentation. It will help you visualize the revenue growth. It is a captivating slide that will help you grab your target audience's attention and make your presentation stand out from the competition. Hurry to grab!
About the template
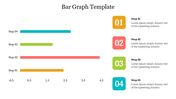
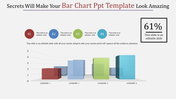
The Revenue Growth Presentation Graph Slide includes a well-crafted graph with six multicolor bars. It has an arrow between the bars, representing the growth. It has six text blocks on the right side of the bar chart to present your notes. It is 100% editable that allows you to personalize the graph with your own data. You can also try our 3D Bar Graph slides to make stunning presentations.
Features of the template
- 100% customizable slides and easy to download.
- Slides are available in different nodes & colors.
- The slide contained 16:9 and 4:3 formats.
- Easy to change the slide colors quickly.
- Well-crafted template with instant download facility.
- Eye-catching graph slide.


You May Also Like These PowerPoint Templates
Add to Wishlist
Download
AI Customize

Add to Wishlist
Download
AI Customize

Add to Wishlist
Download
AI Customize

Add to Wishlist
Download
AI Customize

Add to Wishlist
Download
AI Customize

Add to Wishlist
Download
AI Customize

Add to Wishlist
Download
AI Customize

Add to Wishlist
Download
AI Customize

Add to Wishlist
Download
AI Customize

Add to Wishlist
Download
AI Customize

Free
Add to Wishlist
Download
AI Customize

Add to Wishlist
Download
AI Customize

Add to Wishlist
Download
AI Customize

Add to Wishlist
Download
AI Customize

Add to Wishlist
Download
AI Customize

Add to Wishlist
Download
AI Customize

Add to Wishlist
Download
AI Customize

Add to Wishlist
Download
AI Customize

Add to Wishlist
Download
AI Customize

Add to Wishlist
Download
AI Customize
