Bar Chart Infographic Design PPT Template and Google Slides

A colorful bar chart infographic illustrating three categories: community, competitors, and financial with text area.
P.ID : 65490
    867 views
    116 Downloads
    Get Custom Slides by Experts
    Instantly Access Templates in PowerPoint

    Present Your Business Report With This Bar Chart Template

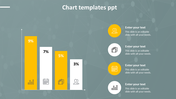
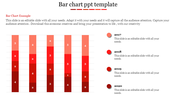
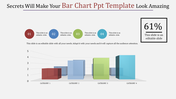
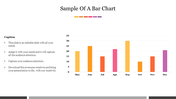
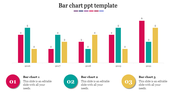
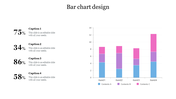
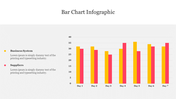
    Give a detailed explanation of your research data with this Bar Chart Template. Three nodes are presented in this template, and a colorful bar chart conveys your research details to the audience. Below the bar diagram, you can add text of each node's facts.

    About The Slide: 

    Notice the numbers on the top of each bar chart which look informative. In addition, the font styles are editable, which can be viewed even by the person sitting in the last row. Never miss this Bar Chart Template in your business plan presentation. In addition, We also have the best Bar chart PPT slides. 

    Features of this template

    • This template is 100% editable(shape color, size & text)
    • This template has a bar chart theme.
    • Drag and drop image placeholder
    • Huge Collections of chart slides to impress your audience
    • It supports an aspect ratio of 4:3
    • Easily readable and acceptable template.
    Advertisement

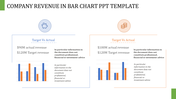
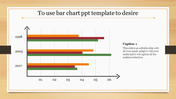
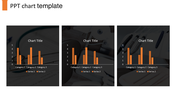
    You May Also Like These PowerPoint Templates

    Add to Wishlist
    Download
    AI Customize
    Progress bar template showing Process A and B side by side, with four stages and completion percentages.
    Add to Wishlist
    Download
    AI Customize
    Presentation slide featuring multicolored bar graphs for categories and a purple and gray pie chart with text sections below.
    Add to Wishlist
    Download
    AI Customize
    Vertical bar chart in red shades, displaying yearly data from 2017 to 2020, with detailed labels on the right.
    Add to Wishlist
    Download
    AI Customize
    Green shaded bar chart displaying data from 2016 to 2021, with three numbered captions below.
    Add to Wishlist
    Download
    AI Customize
    Chart slide showing market supply data from 2004 to 2014 with red bars and percentage annotations.
    Free
    Add to Wishlist
    Download
    AI Customize
    3D bar chart PowerPoint template showcasing data in four colored categories with a highlight and captions.
    Free
    Add to Wishlist
    Download
    AI Customize
    Horizontal chart with dual color bars in green and blue, displaying percentage values, and two captions on the right.
    Add to Wishlist
    Download
    AI Customize
    Slide with a vertical bar chart and four labeled sections, each paired with a unique color and icon.
    Free
    Add to Wishlist
    Download
    AI Customize
    A blue themed slide featuring a multi year bar chart comparison from 2016 to 2021 with three placeholders below.
    Free
    Add to Wishlist
    Download
    AI Customize
    3D chart with five colored bars in gold, red, green, teal, and orange, on individual bases, displaying percentages above.
    Add to Wishlist
    Download
    AI Customize
    Graph with teal and gray bars for project budget, along with expenditure icons and amounts displayed on the right.
    Add to Wishlist
    Download
    AI Customize
    Innovative 3D Progress Bar PowerPoint And Google Slides
    Add to Wishlist
    Download
    AI Customize
    Editable PowerPoint Chart Templates For Presentation
    Add to Wishlist
    Download
    AI Customize
    PowerPoint slide with a bar chart showing data for 2017, 2018, 2019, and 2020 in colorful bars.
    Add to Wishlist
    Download
    AI Customize
    PowerPoint chart template showing stacked bar graphs with different categories and values for each year from 2016 to 2019.
    Add to Wishlist
    Download
    AI Customize
    Bar chart with two sections in orange and green, with captions and numerical values under each.
    Add to Wishlist
    Download
    AI Customize
    Bar chart slide showcasing yearly data from 2016 to 2021, with three distinct bar categories and values in shades of purple.