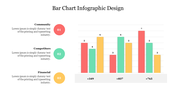
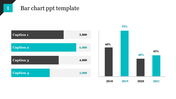
Colorful Bar Chart Infographic PowerPoint Presentation

Infographic bar chart slide displaying daily comparisons for Business System and Supplier metrics.
P.ID : 65480
    329 views
    47 Downloads
    Get Custom Slides by Experts
    Instantly Access Templates in PowerPoint

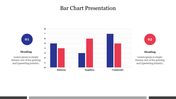
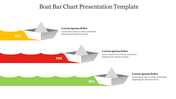
    Two Nodded Bar Chart PPT Slide

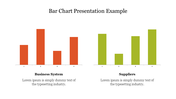
    Download this Bar Chart Infographic PowerPoint Template to make interesting and professional-looking presentations. It will help you present the business system and supplier's data in a clear and concise manner. Using this infographics slide, you easily convey your data to reach your target audience perfectly. 

    About the template:

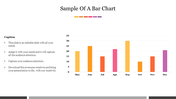
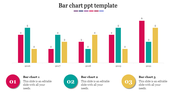
    The Bar Chart Infographic PowerPoint Template has an attractive bar chart in red and yellow color. The grey background helps to enhance the colorful chart. Using this bar chart, you can compare your business system and supplier's data for seven days. It also has legends to present your descriptive data. Find more PowerPoint Bar Chart slides from SlideEgg.

    Features of this template:

    1. 100% customizable slides and easy to download.
    2. Slides available in different nodes & colors.
    3. The slide contained 16:9 and 4:3 format.
    4. Easy to change the slide colors quickly.
    5. Well-crafted template with instant download facility.
    6. It has an attractive bar chart.
    Advertisement

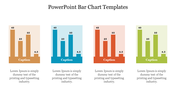
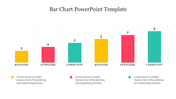
    You May Also Like These PowerPoint Templates

    Add to Wishlist
    Download
    AI Customize
    Blank bar chart template featuring three series of data across four categories, with orange, green, and blue bars.
    Add to Wishlist
    Download
    AI Customize
    3D bar chart with cylindrical bars in yellow, orange, pink, teal, and green, showing percentages and captions below.
    Add to Wishlist
    Download
    AI Customize
    Stunning Revenue Graph PowerPoint Presentation Slide
    Add to Wishlist
    Download
    AI Customize
    Horizontal bar graph slide with four color coded categories in green, yellow, red, and purple, with text descriptions.
    Add to Wishlist
    Download
    AI Customize
    A slide displaying a sample bar chart with monthly data from may to december, featuring colorful bars and descriptive text.
    Add to Wishlist
    Download
    AI Customize
    Horizontal chart with four colored bars, each with a color coded icon and caption on the left.
    Add to Wishlist
    Download
    AI Customize
    Bar chart in four distinct bars in multi colour each showing data points with corresponding labels, values and caption areas.
    Add to Wishlist
    Download
    AI Customize
    Chart PowerPoint slide with bar graph and four icons representing data, calendar, and people with placeholder text.
    Add to Wishlist
    Download
    AI Customize
    3D bar graph slide displaying data trends across five years, with color coded bars representing values with placeholder text.
    Add to Wishlist
    Download
    AI Customize
    Colorful bar graph illustrating monthly data with values for each month from january to december.
    Add to Wishlist
    Download
    AI Customize
    Slide with a businessman holding a megaphone projecting speech bubble displaying communication icons, and bar charts below.
    Add to Wishlist
    Download
    AI Customize
    Creative graph slide with colorful numbered captions and a bar chart displaying varying percentage values from 40% to 80%.
    Free
    Add to Wishlist
    Download
    AI Customize
    Three separate bar charts in red tones, each section labeled with a percentage and caption.
    Free
    Add to Wishlist
    Download
    AI Customize
    Technology themed slide with five horizontal purple bars showing percentages, icons, and descriptive captions.
    Add to Wishlist
    Download
    AI Customize
    Three charts with orange bars displayed against dark backgrounds, each labeled with categories and series.
    Add to Wishlist
    Download
    AI Customize
    Progress bar template showing Process A and B side by side, with four stages and completion percentages.
    Add to Wishlist
    Download
    AI Customize
    Presentation slide featuring multicolored bar graphs for categories and a purple and gray pie chart with text sections below.