Free - Free Bar Chart PPT Template and Google Slides Presentation

Free
Three separate bar charts in red tones, each section labeled with a percentage and caption.
P.ID : 65496
    616 views
    252 Downloads
    Get Custom Slides by Experts
    Instantly Access Templates in PowerPoint

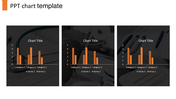
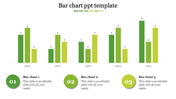
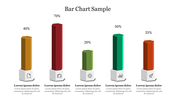
    Free Three Nodded Bar Chart PPT Slide

    Get this Bar Chart PPT Template Free Download for making informative business presentations. Using this slide, you can easily captivate your audience's attention. The multicolor bar chart of this slide will attract your viewer's eyes. It is also fully editable according to your needs. It is an excellent way to get started.


    About the template:

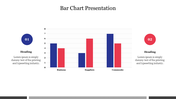
    The Bar Chart PPT Template Free Download includes three vertical bar charts in red and orange shades. The white background beautifully enhances the charts and content. It helps to show the data of your business, suppliers, and community. It is a perfect way to compare your data. You can also find Bar Chart Infographic Slides to make impressive presentations.


    Features of this template:

    1. 100% customizable slides and easy to download.
    2. Slides available in different nodes & colors.
    3. The slide contained 16:9 and 4:3 format.
    4. Easy to change the slide colors quickly.
    5. Well-crafted template with instant download facility.
    6. It looks stunning with three vertical bar charts.
    Advertisement

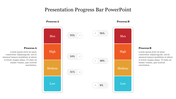
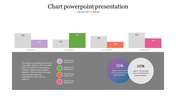
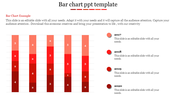
    You May Also Like These PowerPoint Templates

    Add to Wishlist
    Download
    AI Customize
    PowerPoint chart template showing stacked bar graphs with different categories and values for each year from 2016 to 2019.
    Add to Wishlist
    Download
    AI Customize
    Bar chart with two sections in orange and green, with captions and numerical values under each.
    Add to Wishlist
    Download
    AI Customize
    Bar chart slide showcasing yearly data from 2016 to 2021, with three distinct bar categories and values in shades of purple.
    Add to Wishlist
    Download
    AI Customize
    Slide featuring a 3D bar graph with three series on dark backdrop, a green star shaped badge, and text boxes below.
    Add to Wishlist
    Download
    AI Customize
    Data analysis slide with four bar charts in red, green, yellow, and orange, surrounding a dark text box in the center.
    Add to Wishlist
    Download
    AI Customize
    PowerPoint bar chart design slide featuring various colored flags and labeled categories at the bottom.
    Add to Wishlist
    Download
    AI Customize
    Simple Bar Chart Layout PowerPoint Presentation
    Add to Wishlist
    Download
    AI Customize
    Bar chart slide design with stacked bars showing three categories per item and percentage captions on the left.
    Add to Wishlist
    Download
    AI Customize
    PowerPoint template with two bar charts, one green, and one blue, representing four categories.
    Add to Wishlist
    Download
    AI Customize
    Colorful bar chart PPT template displaying four sections with data values and corresponding captions for 2018 to 2021.
    Free
    Add to Wishlist
    Download
    AI Customize
    PowerPoint slide with a bar chart showcasing three data series for different examples.
    Add to Wishlist
    Download
    AI Customize
    Chart layout with stacked bar graphs in red, yellow, green, and teal representing A1 to A8, with captions above.
    Free
    Add to Wishlist
    Download
    AI Customize
    Red themed template with four circular percentage indicators over rounded bars, aligned with icons and captions.
    Add to Wishlist
    Download
    AI Customize
    Slide showing a bar chart with values for 2017, 2018, 2019, and 2020, with each year represented in different shades of blue.
    Free
    Add to Wishlist
    Download
    AI Customize
    Chart with colorful bars representing yearly data from 2013 to 2020, paired with eight colorful cube icons on the sides.
    Free
    Add to Wishlist
    Download
    AI Customize
    Bar chart PowerPoint slides showcasing different business categories with colorful bars in different layout designs.
    Free
    Add to Wishlist
    Download
    AI Customize
    Annual report slide displaying a bar chart with color-coded percentages from 30% to 80% and caption areas.