Free - Get the Best Bar Chart PPT Template Presentation Design
Free

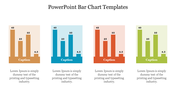
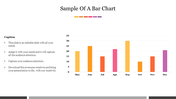
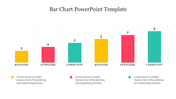
Bar Chart PowerPoint Template
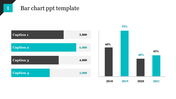
Looking for a template to present your data? Our Bar Chart PowerPoint Template helps you with that. The slide comes with a bar chart representation with a professional color palette. Values are provided in the form of percentage in the horizontal manner.
Captions and brief descriptions are given with customisable options. Perfect for analysts, business leaders, and presenters. Suitable template for showcasing financial metrics, market trends, or performance indicators. Download now to elevate your presentations effortlessly.
Features of the template
- 100% customizable slides and free to download.
- Slides are available in different nodes & colors.
- The slide contains 16:9 and 4:3 formats.
- It is easy to change the colors of the slide quickly.
- Well-crafted template with an instant download facility.


You May Also Like These PowerPoint Templates


Add to Wishlist
Download
Edit


Add to Wishlist
Download
Edit


Add to Wishlist
Download
Edit


Add to Wishlist
Download
Edit

Add to Wishlist
Download
Edit


Add to Wishlist
Download
Edit

Add to Wishlist
Download
Edit


Showing20 of69,218 templates