Effective Horizontal Bar Graph PowerPoint PPT Template

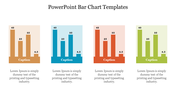
Horizontal Bar Graph Presentation Slide
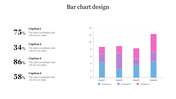
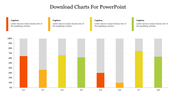
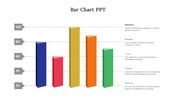
A horizontal bar graph is a graphical representation of data that uses horizontal bars to display the values of different categories. The length of each bar corresponds to the value of the category it represents, and the bars are positioned horizontally on a graph. Horizontal bar graphs are useful for comparing the relative sizes of different categories, and they are often used to present data in a visually appealing and easy-to-understand format. They can be found in a variety of contexts, including business, science, and education. You can impress your audience with this sleek template
Features of the template:
- 100% customizable slide and easy to download.
- The slide contained 16:9 and 4:3 format.
- Well-crafted template with an instant download facility.
- Highly compatible with PowerPoint and Google Slides.
- This slide has a colorful design pattern.
- Easy to change the slide colors.


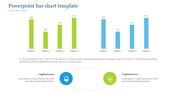
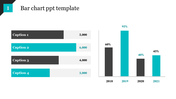
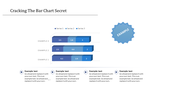
You May Also Like These PowerPoint Templates
Add to Wishlist
Download
AI Customize

Add to Wishlist
Download
AI Customize

Add to Wishlist
Download
AI Customize

Add to Wishlist
Download
AI Customize

Add to Wishlist
Download
AI Customize

Add to Wishlist
Download
AI Customize

Add to Wishlist
Download
AI Customize

Add to Wishlist
Download
AI Customize

Add to Wishlist
Download
AI Customize

Add to Wishlist
Download
AI Customize

Add to Wishlist
Download
AI Customize

Add to Wishlist
Download
AI Customize

Add to Wishlist
Download
AI Customize

Add to Wishlist
Download
AI Customize

Add to Wishlist
Download
AI Customize


Add to Wishlist
Download
AI Customize

Add to Wishlist
Download
AI Customize

Free
Add to Wishlist
Download
AI Customize

Add to Wishlist
Download
AI Customize
