Free - Creative Graph Template For PPT Presentation

Free
Slide with a sloping bar graph in green and gray segments, three numbered points, and a text box on the right.
P.ID : 4347
    1K+ views
    182 Downloads
    Get Custom Slides by Experts
    Instantly Access Templates in PowerPoint

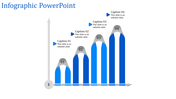
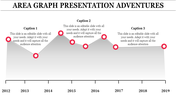
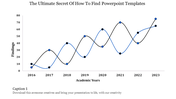
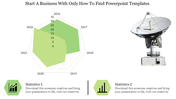
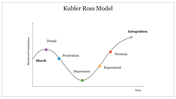
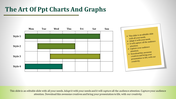
    Graph PPT Templates and Google Slides


    Unlock the power of data visualization with our extraordinary graph templates. Each graph is a work of art, carefully crafted to convey trends, patterns, and insights at a glance. With a seamless blend of aesthetics and functionality, our graph templates empower you to tell a story with data, captivate your audience, and make informed decisions. Elevate your presentations and reports with these visually stunning and informative graph templates.

    Features of the template

    • 100% customizable slides and easy to download.
    • Slides are available in different nodes & colors.
    • The slide contains 16:9 and 4:3 formats.
    • Easy to change the colors of the slides quickly.
    • Well-crafted template with an instant download facility.
    • Highly compatible with PowerPoint and Google Slides.
    Advertisement

    You May Also Like These PowerPoint Templates

    Add to Wishlist
    Download
    AI Customize
    Line graph displaying trends across four categories with three distinct colored lines and percentage highlights below.
    Add to Wishlist
    Download
    AI Customize
    PowerPoint slide showing a quick fact about music's impact, with a graph displaying intelligence levels and famous composers.
    Add to Wishlist
    Download
    AI Customize
    PowerPoint template showing a line graph with three products A, B, and C plotted over time from 2015 to 2019.
    Free
    Add to Wishlist
    Download
    AI Customize
    Slide with a sloping bar graph in green and gray segments, three numbered points, and a text box on the right.
    Add to Wishlist
    Download
    AI Customize
    Two vertical bar charts with three columns each, alongside captions with percentages in varying shades of orange.
    Free
    Add to Wishlist
    Download
    AI Customize
    Revenue analysis slide with bar chart, financial icon, and two descriptive sections for customer metrics.
    Free
    Add to Wishlist
    Download
    AI Customize
    3D bar graph with six green bars of varying heights, labeled placeholders, and a gray sidebar with text blocks.
    Free
    Add to Wishlist
    Download
    AI Customize
    Visual layout of various charts, including area and bar graphs, arranged in a grid format with caption areas.
    Free
    Add to Wishlist
    Download
    AI Customize
    Comparison of revenue and cost distributions with pie charts displaying CAPEX and OPEX percentages.
    Add to Wishlist
    Download
    AI Customize
    Slide showing a graph of the Dunning-Kruger Effect with stages from knowing nothing to becoming an expert with a title text.
    Add to Wishlist
    Download
    AI Customize
    Narrative arc slide displaying key plot stages with placeholder text areas.
    Add to Wishlist
    Download
    AI Customize
    Line graph slide with two data series in red and yellow, showing item based data fluctuations and a text caption.
    Add to Wishlist
    Download
    AI Customize
    Graph showing an upward curve with captions along key points, indicating growth or improvement over time.
    Add to Wishlist
    Download
    AI Customize
    A curve graph with two lines in teal and black and six labeled points, with corresponding captions on the right.
    Add to Wishlist
    Download
    AI Customize
    A collection of story arc slides featuring graphs illustrating rising action, climax, and resolution points for storytelling.
    Add to Wishlist
    Download
    AI Customize
    An S shaped curve graph with three key points, illustrating growth or change over time with captions.
    Add to Wishlist
    Download
    AI Customize
    Positively skewed histogram with blue bars, three highlighted data points, and a centered orange button at the bottom.