Line Graph Download PPT Template and Google Slides

Two line graphs comparing data trends with different colors, featuring seven data points on each chart.
P.ID : 60254
    557 views
    79 Downloads
    Get Custom Slides by Experts
    Instantly Access Templates in PowerPoint

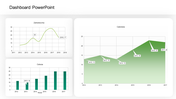
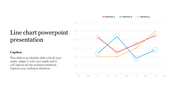
    Line Graph PowerPoint Template

    Get this Line Graph Download PPT Slide to make the best presentation instantly. You can use it to make a presentation or report that has multiple charts. It will help you to generate a nice-looking presentation that will really attract the eyes of your audience. Download this best chart PowerPoint Slide for making a professional-looking presentation.

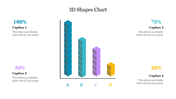
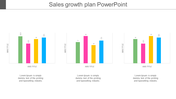
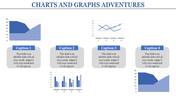
    The Line Graph Download PPT Slide has two line charts, and each chart shows two sets of data. Using this slide, you can easily compare the data. It allows you to change the background, fonts, colors, etc. It is well-designed to help you in making the best presentations instantly. Download it right now!

    Features of this template:

    1. 100% customizable slides and easy to download.
    2. Slides available in different nodes & colors.
    3. The slide contained 16:9 and 4:3 format.
    4. Easy to change the slide colors quickly.
    5. Well-crafted template with instant download facility.
    6. The best slide with two line charts.
    Advertisement

    You May Also Like These PowerPoint Templates

    Add to Wishlist
    Download
    AI Customize
    Slide featuring two line graphs and bar charts in green, comparing data across months and quarters.
    Add to Wishlist
    Download
    AI Customize
    Chart design slide tracking article likes, comments, shares, total posts, and new subscriber growth with visual graphs.
    Add to Wishlist
    Download
    AI Customize
    Chart presentation template with a bar graph showing the progress of four projects with percentages.
    Free
    Add to Wishlist
    Download
    AI Customize
    Line chart template with three data series in blue, teal, black, and text sections.
    Add to Wishlist
    Download
    AI Customize
    Chart PPT template with bar graphs showing clicks and recipients, a pie chart for email categories, and a line graph.
    Add to Wishlist
    Download
    AI Customize
    Gradient-styled horizontal bar chart with blue and green bars, labeled text areas, and a light blue background.
    Add to Wishlist
    Download
    AI Customize
    Bar chart with four vertical orange columns, gray numbered tops, captions, and a dollar sign axis on a white background.
    Free
    Add to Wishlist
    Download
    AI Customize
    Bubble chart on the right with varying circle sizes and a dark blue section on the left featuring three headings and text.
    Add to Wishlist
    Download
    AI Customize
    Chart presentation template displaying monthly data for Visitors, New Customers, and Leads with bar and line charts.
    Add to Wishlist
    Download
    AI Customize
    Gantt chart PowerPoint template displaying project tasks over a four week timeline with placeholder text.
    Add to Wishlist
    Download
    AI Customize
    Versatile PowerPoint Chart Templates for Data Insights
    Add to Wishlist
    Download
    AI Customize
    Horizontal bar chart with three color-coded series, labeled values, and a left side legend with numbered captions.
    Add to Wishlist
    Download
    AI Customize
    Slide deck with multiple circular progress bars in various colors, showing percentages and captions below.
    Add to Wishlist
    Download
    AI Customize
    Slide with a horizontal bar chart on the left and 3D cylindrical percentage charts in blue, green, and teal, on the right.
    Add to Wishlist
    Download
    AI Customize
    Horizontal bar chart with four labeld sections A to D, in purple, pink, teal, and blue, and captions below.