Easy To Editable Bar Graph PPT And Google Slides Template

Colorful bar graph illustrating monthly data with values for each month from january to december.
P.ID : 4199
    1.9K+ views
    153 Downloads
    Get Custom Slides by Experts
    Instantly Access Templates in PowerPoint

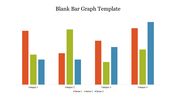
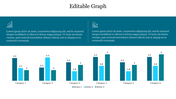
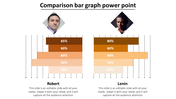
    Bar Graph PowerPoint Slide


    Unlock the power of visual representation with our expertly crafted bar graph PowerPoint template. Transform mundane data into impactful insights with these dynamic designs tailored for clarity and effectiveness. Crafted with a focus on delivering helpful content, our bar graph template ensures your data tells a compelling story. Whether you're presenting sales figures, market trends, or project milestones, our template makes the process smooth and visually engaging. The key features of our bar graph PowerPoint lie in their 100% editable and customizable nature. Tailor each element to suit your specific needs, ensuring a personalized touch that resonates with your audience. Download this template today and elevate your data presentation game. Empower your communication with visuals that leave a lasting impression.

    Features of this template


    • 100% customizable slides and easy to download.
    • The slide contains 16:9 and 4:3 formats.
    • Easy to change the colors of the slide quickly.
    • Highly compatible with PowerPoint and Google Slides.
    Advertisement

    You May Also Like These PowerPoint Templates

    Add to Wishlist
    Download
    AI Customize
    A slide displaying a sample bar chart with monthly data from may to december, featuring colorful bars and descriptive text.
    Add to Wishlist
    Download
    AI Customize
    Horizontal chart with four colored bars, each with a color coded icon and caption on the left.
    Add to Wishlist
    Download
    AI Customize
    Bar chart in four distinct bars in multi colour each showing data points with corresponding labels, values and caption areas.
    Add to Wishlist
    Download
    AI Customize
    Chart PowerPoint slide with bar graph and four icons representing data, calendar, and people with placeholder text.
    Add to Wishlist
    Download
    AI Customize
    Infographic bar chart slide displaying daily comparisons for Business System and Supplier metrics.
    Add to Wishlist
    Download
    AI Customize
    Comparison chart with horizontal green bars displaying data for four examples across three series.
    Add to Wishlist
    Download
    AI Customize
    3D bar graph slide displaying data trends across five years, with color coded bars representing values with placeholder text.
    Add to Wishlist
    Download
    AI Customize
    Stacked bar chart template with green gradients, showing data from 2017 to 2020, with labeled sections.
    Free
    Add to Wishlist
    Download
    AI Customize
    Colorful bar chart with three data categories and corresponding bars each with caption areas.
    Add to Wishlist
    Download
    AI Customize
    Colorful bar graph illustrating monthly data with values for each month from january to december.
    Add to Wishlist
    Download
    AI Customize
    Slide with a businessman holding a megaphone projecting speech bubble displaying communication icons, and bar charts below.
    Add to Wishlist
    Download
    AI Customize
    Illustration of a chart with yellow, red, and green horizontal bars displaying percentages and paper boat icons on waves.
    Free
    Add to Wishlist
    Download
    AI Customize
    Three separate bar charts in red tones, each section labeled with a percentage and caption.
    Add to Wishlist
    Download
    AI Customize
    Colorful progress bars in rows, showing numbered squares in red, teal, purple, and blue, with text on the right.
    Free
    Add to Wishlist
    Download
    AI Customize
    Technology themed slide with five horizontal purple bars showing percentages, icons, and descriptive captions.
    Add to Wishlist
    Download
    AI Customize
    Horizontal bar graph slide with four colored steps and corresponding descriptions on the right.
    Add to Wishlist
    Download
    AI Customize
    Three charts with orange bars displayed against dark backgrounds, each labeled with categories and series.
    Add to Wishlist
    Download
    AI Customize
    Progress bar template showing Process A and B side by side, with four stages and completion percentages.
    Add to Wishlist
    Download
    AI Customize
    Presentation slide featuring multicolored bar graphs for categories and a purple and gray pie chart with text sections below.
    Add to Wishlist
    Download
    AI Customize
    Vertical bar chart in red shades, displaying yearly data from 2017 to 2020, with detailed labels on the right.