Editable PowerPoint Graph Template Slide

A slide featuring four bar graphs labeled A, B, C, and D with caption areas underneath, connected by dotted arrows.
P.ID : 60498
    1.5K+ views
    233 Downloads
    Get Custom Slides by Experts
    Instantly Access Templates in PowerPoint

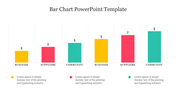
    Comparison PPT Graph Template


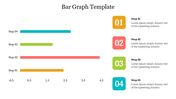
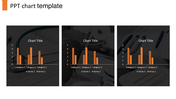
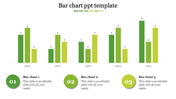
    How about downloading this Graph PowerPoint template to give a detailed explanation of your presentation. Yes, you can use this template to compare your business's various factors.


    The template is added with four nodes designed in a graph to make the best out. You will be able to represent the factors neatly and creatively so that your audience will understand the representation easily.


    Since this template is fully customized, it is easier to edit and download. You will be able to add on the features using this user-friendly template. Get this 100% satisfaction using this statistical representation. Make sure to download this great representation on this topic. Download now!.


    Features of this Template:

    • Easy to change the slide colors quickly.
    • Well-crafted template with instant download facility.
    • 100% customizable slides and easy to download.
    • Slides are given in different nodes & colors.
    • The slide is designed in 16:9 and 4:3 format.
    • Graph design with four nodes.
    • Highly compatible with PowerPoint, Google Slides and Canva templates
    Advertisement

    You May Also Like These PowerPoint Templates

    Free
    Add to Wishlist
    Download
    AI Customize
    Horizontal chart with dual color bars in green and blue, displaying percentage values, and two captions on the right.
    Add to Wishlist
    Download
    AI Customize
    Slide with a vertical bar chart and four labeled sections, each paired with a unique color and icon.
    Free
    Add to Wishlist
    Download
    AI Customize
    A blue themed slide featuring a multi year bar chart comparison from 2016 to 2021 with three placeholders below.
    Free
    Add to Wishlist
    Download
    AI Customize
    3D chart with five colored bars in gold, red, green, teal, and orange, on individual bases, displaying percentages above.
    Add to Wishlist
    Download
    AI Customize
    Graph with teal and gray bars for project budget, along with expenditure icons and amounts displayed on the right.
    Add to Wishlist
    Download
    AI Customize
    Innovative 3D Progress Bar PowerPoint And Google Slides
    Add to Wishlist
    Download
    AI Customize
    Editable PowerPoint Chart Templates For Presentation
    Add to Wishlist
    Download
    AI Customize
    PowerPoint slide with a bar chart showing data for 2017, 2018, 2019, and 2020 in colorful bars.
    Add to Wishlist
    Download
    AI Customize
    PowerPoint chart template showing stacked bar graphs with different categories and values for each year from 2016 to 2019.
    Add to Wishlist
    Download
    AI Customize
    Bar chart with two sections in orange and green, with captions and numerical values under each.
    Add to Wishlist
    Download
    AI Customize
    Bar chart slide showcasing yearly data from 2016 to 2021, with three distinct bar categories and values in shades of purple.
    Add to Wishlist
    Download
    AI Customize
    Slide featuring a 3D bar graph with three series on dark backdrop, a green star shaped badge, and text boxes below.
    Add to Wishlist
    Download
    AI Customize
    Data analysis slide with four bar charts in red, green, yellow, and orange, surrounding a dark text box in the center.
    Add to Wishlist
    Download
    AI Customize
    PowerPoint bar chart design slide featuring various colored flags and labeled categories at the bottom.
    Add to Wishlist
    Download
    AI Customize
    Simple Bar Chart Layout PowerPoint Presentation
    Add to Wishlist
    Download
    AI Customize
    Bar chart slide design with stacked bars showing three categories per item and percentage captions on the left.
    Add to Wishlist
    Download
    AI Customize
    PowerPoint template with two bar charts, one green, and one blue, representing four categories.