Stunning Chart Template For PowerPoint Presentation

Chart slide showing market supply data from 2004 to 2014 with red bars and percentage annotations.
P.ID : 32059
    471 views
    29 Downloads
    Get Custom Slides by Experts
    Instantly Access Templates in PowerPoint

    Attractive Chart Slide Template PowerPoint Presentation

    Try out these Best Chart PowerPoint to have the ability to attain successful conversations. Choose this template from SlideEgg to create a splendid statistics presentation. 100% editable & customizable presentation.

    About the Template:

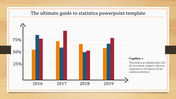
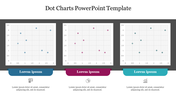
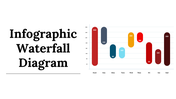
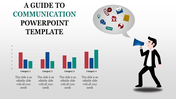
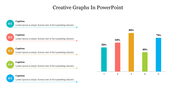
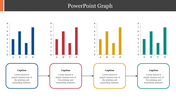
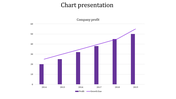
    The Best Chart Templates for PowerPoint will make your presentation job easier. You can show your extraordinary competence by using this template in market supply. The bar graph image will create an effective change among your colleagues. If your presentation is text-heavy, then this white background will play its role in attracting the maximum audience quickly.

    Features of the Template:

    • Innovative slide background designs
    • 100% easy to edit and customize slides
    • The slide contained 16:9 and 4:3 formats.
    • Easy to change the slide colors quickly.
    • The elegant look of this template will give life to your presentation.
    • Crisp and clear font styles.
    • Fantastic slide template.
    Advertisement

    You May Also Like These PowerPoint Templates

    Add to Wishlist
    Download
    AI Customize
    Bar chart with two sections in orange and green, with captions and numerical values under each.
    Add to Wishlist
    Download
    AI Customize
    Simple Bar Chart Layout PowerPoint Presentation
    Add to Wishlist
    Download
    AI Customize
    PowerPoint template with two bar charts, one green, and one blue, representing four categories.
    Add to Wishlist
    Download
    AI Customize
    Progress Bar Design PowerPoint Template & Google Slides
    Add to Wishlist
    Download
    AI Customize
    Slide deck with various colorful bar charts, featuring vertical and horizontal bars in different colors to represent data.
    Add to Wishlist
    Download
    AI Customize
    Blank bar chart template featuring three series of data across four categories, with orange, green, and blue bars.
    Add to Wishlist
    Download
    AI Customize
    Stunning Revenue Graph PowerPoint Presentation Slide
    Add to Wishlist
    Download
    AI Customize
    Horizontal bar graph slide with four color coded categories in green, yellow, red, and purple, with text descriptions.
    Add to Wishlist
    Download
    AI Customize
    A slide displaying a sample bar chart with monthly data from may to december, featuring colorful bars and descriptive text.
    Add to Wishlist
    Download
    AI Customize
    Horizontal chart with four colored bars, each with a color coded icon and caption on the left.
    Add to Wishlist
    Download
    AI Customize
    Bar chart in four distinct bars in multi colour each showing data points with corresponding labels, values and caption areas.
    Add to Wishlist
    Download
    AI Customize
    Chart PowerPoint slide with bar graph and four icons representing data, calendar, and people with placeholder text.
    Add to Wishlist
    Download
    AI Customize
    Colorful bar graph illustrating monthly data with values for each month from january to december.
    Free
    Add to Wishlist
    Download
    AI Customize
    Three separate bar charts in red tones, each section labeled with a percentage and caption.
    Add to Wishlist
    Download
    AI Customize
    Three charts with orange bars displayed against dark backgrounds, each labeled with categories and series.
    Add to Wishlist
    Download
    AI Customize
    Progress bar template showing Process A and B side by side, with four stages and completion percentages.
    Add to Wishlist
    Download
    AI Customize
    Presentation slide featuring multicolored bar graphs for categories and a purple and gray pie chart with text sections below.