PowerPoint Chart Templates for Effective Data Visualization

Three step chart template featuring a bar graph with red, orange, and yellow bars alongside numbered captions.
P.ID : 8934
    427 views
    29 Downloads
    Get Custom Slides by Experts
    Instantly Access Templates in PowerPoint

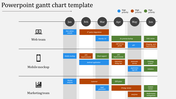
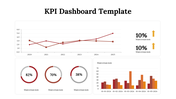
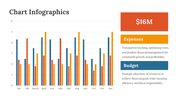
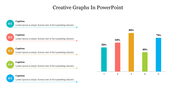
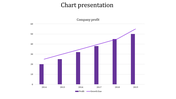
    Chart Presentation Template


    In today's busy business world, creating presentations that catch the eye and deliver information effectively is crucial. That's where our PowerPoint chart templates shine.

    This slide features a lively bar chart in vibrant orange, our template adds warmth and energy to your data comparisons. It's ideal for showcasing financial stats, sales figures, or market trends, making your presentation more engaging and memorable.

    Download our chart PowerPoint templates today. With a few simple clicks, you'll unlock a variety of professionally designed slides that captivate, inform, and inspire your audience. Explore our collection now and discover the perfect template to make your presentations stand out.

    Features of the template:

    • Easy to change the slide colors.
    • 100 % customizable slides and easy to download.
    • Well-crafted template with instant download.
    Advertisement

    You May Also Like These PowerPoint Templates

    Add to Wishlist
    Download
    AI Customize
    Bar chart with two sections in orange and green, with captions and numerical values under each.
    Add to Wishlist
    Download
    AI Customize
    Simple Bar Chart Layout PowerPoint Presentation
    Add to Wishlist
    Download
    AI Customize
    PowerPoint template with two bar charts, one green, and one blue, representing four categories.
    Add to Wishlist
    Download
    AI Customize
    Progress Bar Design PowerPoint Template & Google Slides
    Add to Wishlist
    Download
    AI Customize
    Slide deck with various colorful bar charts, featuring vertical and horizontal bars in different colors to represent data.
    Add to Wishlist
    Download
    AI Customize
    Blank bar chart template featuring three series of data across four categories, with orange, green, and blue bars.
    Add to Wishlist
    Download
    AI Customize
    Stunning Revenue Graph PowerPoint Presentation Slide
    Add to Wishlist
    Download
    AI Customize
    Horizontal bar graph slide with four color coded categories in green, yellow, red, and purple, with text descriptions.
    Add to Wishlist
    Download
    AI Customize
    A slide displaying a sample bar chart with monthly data from may to december, featuring colorful bars and descriptive text.
    Add to Wishlist
    Download
    AI Customize
    Horizontal chart with four colored bars, each with a color coded icon and caption on the left.
    Add to Wishlist
    Download
    AI Customize
    Bar chart in four distinct bars in multi colour each showing data points with corresponding labels, values and caption areas.
    Add to Wishlist
    Download
    AI Customize
    Chart PowerPoint slide with bar graph and four icons representing data, calendar, and people with placeholder text.
    Add to Wishlist
    Download
    AI Customize
    Colorful bar graph illustrating monthly data with values for each month from january to december.
    Free
    Add to Wishlist
    Download
    AI Customize
    Three separate bar charts in red tones, each section labeled with a percentage and caption.
    Add to Wishlist
    Download
    AI Customize
    Three charts with orange bars displayed against dark backgrounds, each labeled with categories and series.
    Add to Wishlist
    Download
    AI Customize
    Progress bar template showing Process A and B side by side, with four stages and completion percentages.
    Add to Wishlist
    Download
    AI Customize
    Presentation slide featuring multicolored bar graphs for categories and a purple and gray pie chart with text sections below.