Editable Presentation Progress Bar PowerPoint Template

Progress bar template showing Process A and B side by side, with four stages and completion percentages.
P.ID : 66284
    135 views
    11 Downloads
    Get Custom Slides by Experts
    Instantly Access Templates in PowerPoint

    Eight Noded Progress Bar Presentation Slide  

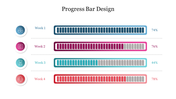
    Shop Now! Our Presentation Progress Bar PowerPoint Template will help you present the progress status of the projects in a more professional manner. This slide will help you design a creative presentation to compare the status of the projects. It is a 100% editable slide and ready for instant download.

    About the template:

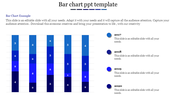
    The Best Presentation Progress Bar PowerPoint Template features eight multicolor nodes representing maximum, high, medium, and low. It has text holders for processes A and B to present your notes. It has catchy colors to make your presentations attractive. With this slide, you can easily and instantly make creative chart presentations. Hurry to grab!

    Features of this template:

    1. 100% customizable slides and easy to download.
    2. Slides available in different nodes & colors.
    3. The slide contained 16:9 and 4:3 formats.
    4. Easy to change the slide colors quickly.
    5. Well-crafted template with instant download facility.
    6. Helps to present the progress status of the projects.
    Advertisement

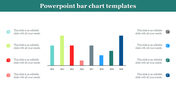
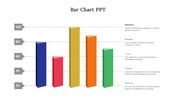
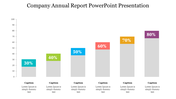
    You May Also Like These PowerPoint Templates

    Add to Wishlist
    Download
    AI Customize
    A slide with a comparison chart featuring two designs, each with steps and bar graphs in orange, red, blue, green and purple.
    Add to Wishlist
    Download
    AI Customize
    Bar chart slide showing data trends from 2016 to 2021 with three categories, highlighted in red, teal, and yellow bars.
    Add to Wishlist
    Download
    AI Customize
    Circular progress bar with four colorful concentric rings and percentage labels, surrounded by text areas.
    Free
    Add to Wishlist
    Download
    AI Customize
    Top Notch Comparison Bar Graph PowerPoint Presentation
    Add to Wishlist
    Download
    AI Customize
    A slide displaying a sample bar chart with monthly data from may to december, featuring colorful bars and descriptive text.
    Add to Wishlist
    Download
    AI Customize
    Horizontal chart with four colored bars, each with a color coded icon and caption on the left.
    Add to Wishlist
    Download
    AI Customize
    Bar chart in four distinct bars in multi colour each showing data points with corresponding labels, values and caption areas.
    Add to Wishlist
    Download
    AI Customize
    Chart PowerPoint slide with bar graph and four icons representing data, calendar, and people with placeholder text.
    Add to Wishlist
    Download
    AI Customize
    Infographic bar chart slide displaying daily comparisons for Business System and Supplier metrics.
    Add to Wishlist
    Download
    AI Customize
    Comparison chart with horizontal green bars displaying data for four examples across three series.
    Add to Wishlist
    Download
    AI Customize
    3D bar graph slide displaying data trends across five years, with color coded bars representing values with placeholder text.
    Add to Wishlist
    Download
    AI Customize
    Stacked bar chart template with green gradients, showing data from 2017 to 2020, with labeled sections.
    Free
    Add to Wishlist
    Download
    AI Customize
    Colorful bar chart with three data categories and corresponding bars each with caption areas.
    Add to Wishlist
    Download
    AI Customize
    Colorful bar graph illustrating monthly data with values for each month from january to december.
    Add to Wishlist
    Download
    AI Customize
    Slide with a businessman holding a megaphone projecting speech bubble displaying communication icons, and bar charts below.
    Add to Wishlist
    Download
    AI Customize
    Illustration of a chart with yellow, red, and green horizontal bars displaying percentages and paper boat icons on waves.