MILESTONE 🌟 5 Million+ creative minds trust SlideEgg! Grab 80% OFF

Bar Chart PPT Template for Detailed Data Visualization

Slide showing a bar chart with values for 2017, 2018, 2019, and 2020, with each year represented in different shades of blue.
P.ID : 25950
    573 views
    53 Downloads
    Get Custom Slides by Experts
    Instantly Access Templates in PowerPoint

    Visualize Data Effectively: Bar Chart PowerPoint Template 


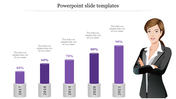
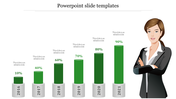
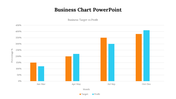
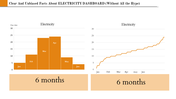
    Embark on a journey of data visualization excellence with our Bar Chart PPT Template and Google Slides Themes. This dynamic template features four sleek, blue-themed bars meticulously crafted to showcase your data with clarity and precision. Each bar comes equipped with a dedicated text area and a year holder, allowing you to present your information in a structured and compelling manner. Whether you're a business analyst, educator, or researcher, this versatile tool empowers you to effectively communicate insights, trends, and performance metrics to your audience. Elevate your presentations, captivate your stakeholders, and unlock the potential of your data with our Bar Chart Slides. Harness the power of visual storytelling and make an impact that resonates.

    Features of the template


    • 100% customizable slides are easy to download.
    • Slides are available in different colors.
    • The slide has 4:3 and 16:9 formats.
    • It is easy to change the slide colors quickly.
    • It has a cute design to impress an audience.
    • Create feature-rich, animated presentations.
    • This slide is available in both PowerPoint and Google Slides.
    Advertisement

    You May Also Like These PowerPoint Templates

    Free
    Add to Wishlist
    Download
    AI Customize
    Five triangular red pyramids arranged by size with corresponding percentage values, set against a minimalist gray background.
    Add to Wishlist
    Download
    AI Customize
    Dashboard overview slide displaying traffic, payment, server load, expenses, and product metrics using graphs and charts.
    Free
    Add to Wishlist
    Download
    AI Customize
    Bar graph comparing financial data with blue and purple theme, with a text box explaining a high level approach.
    Add to Wishlist
    Download
    AI Customize
    Simple Bar Chart Layout PowerPoint Presentation
    Add to Wishlist
    Download
    AI Customize
    PowerPoint template with two bar charts, one green, and one blue, representing four categories.
    Free
    Add to Wishlist
    Download
    AI Customize
    Red themed template with four circular percentage indicators over rounded bars, aligned with icons and captions.
    Add to Wishlist
    Download
    AI Customize
    Progress Bar Design PowerPoint Template & Google Slides
    Add to Wishlist
    Download
    AI Customize
    Slide deck with various colorful bar charts, featuring vertical and horizontal bars in different colors to represent data.
    Add to Wishlist
    Download
    AI Customize
    Blank bar chart template featuring three series of data across four categories, with orange, green, and blue bars.
    Add to Wishlist
    Download
    AI Customize
    3D bar chart with cylindrical bars in yellow, orange, pink, teal, and green, showing percentages and captions below.
    Add to Wishlist
    Download
    AI Customize
    Stunning Revenue Graph PowerPoint Presentation Slide
    Add to Wishlist
    Download
    AI Customize
    Horizontal bar graph slide with four color coded categories in green, yellow, red, and purple, with text descriptions.
    Add to Wishlist
    Download
    AI Customize
    A slide displaying a sample bar chart with monthly data from may to december, featuring colorful bars and descriptive text.
    Add to Wishlist
    Download
    AI Customize
    Horizontal chart with four colored bars, each with a color coded icon and caption on the left.
    Add to Wishlist
    Download
    AI Customize
    Bar chart in four distinct bars in multi colour each showing data points with corresponding labels, values and caption areas.
    Add to Wishlist
    Download
    AI Customize
    Chart PowerPoint slide with bar graph and four icons representing data, calendar, and people with placeholder text.
    Add to Wishlist
    Download
    AI Customize
    3D bar graph slide displaying data trends across five years, with color coded bars representing values with placeholder text.