Free - Inventive KPI Dashboard PowerPoint Template Presentation

Free
Bar graph comparing financial data with blue and purple theme, with a text box explaining a high level approach.
P.ID : 2141
    522 views
    102 Downloads
    Get Custom Slides by Experts
    Instantly Access Templates in PowerPoint

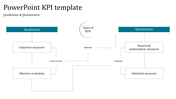
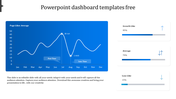
    Elegant KPI Dashboard Presentation Slides


    At SlideEgg, we proudly present our KPI Dashboard PowerPoint Template! Take your data analysis and performance tracking to the next level with this visually stunning and highly functional template. Whether you're a business professional, a project manager, or an analyst, this template will help you effectively monitor and measure key performance indicators. With its attractive design and intuitive layout, you can easily present complex data in a visually appealing and easy-to-understand manner. Impress your audience with dynamic charts, graphs, and visual elements that highlight your key metrics and drive your decision-making. 


    Features of the template

    • 100% customizable slides and easy to download.
    • Slides are available in different nodes & colors.
    • The slide contains 16:9 and 4:3 formats.
    • Easy to change the slide colors quickly.
    • Well-crafted template with an instant download facility. 
    • Access on both MS PowerPoint and Google Slides.
    Advertisement

    You May Also Like These PowerPoint Templates

    Add to Wishlist
    Download
    AI Customize
    Circular tachometer design with a central gauge and surrounding colored segments, each linked to captions on the right.
    Add to Wishlist
    Download
    AI Customize
    A vertical green color bar chart slide displaying loss data from 2014 to 2019, with the title at the top.
    Add to Wishlist
    Download
    AI Customize
    Dashboard slide showing colour coded plant growth chart with progress ring visuals and percentages.
    Add to Wishlist
    Download
    AI Customize
    Dashboard slide with a world map, two semi circular gauges, a pie chart, and a bar graph in a gray and red theme.
    Add to Wishlist
    Download
    AI Customize
    Dashboard slide showing sales bar chart with a highlighted value and a gauge representing business metrics.
    Add to Wishlist
    Download
    AI Customize
    A colorful pie chart diagram with concentric circles showing percentages for different data categories in 2021.
    Free
    Add to Wishlist
    Download
    AI Customize
    Map-based analysis design with statistical data visuals including circular graphs and demographic distributions.
    Add to Wishlist
    Download
    AI Customize
    KPI dashboard layout with blue and green line graphs at the top and shaded bar charts at the bottom in gradient colors.
    Free
    Add to Wishlist
    Download
    AI Customize
    Gantt chart slide showing six tasks with progress bars, each reflecting completion levels ranging from 30% to 80%.
    Add to Wishlist
    Download
    AI Customize
    Financial dashboard with bar charts in pink and blue, colored circular pie charts, and teal boxes highlighting metrics.
    Add to Wishlist
    Download
    AI Customize
    Speedometer template with a needle pointing at 70%, featuring a section in a whote backdrop for a caption areas.
    Add to Wishlist
    Download
    AI Customize
    Four orange pie charts with center numbers from 01 to 04, each with text placeholders on the right.
    Add to Wishlist
    Download
    AI Customize
    Microsoft PowerPoint slide featuring three donut charts in yellow, orange, and pink, each with different percentage values.
    Add to Wishlist
    Download
    AI Customize
    Speedometer template with four gauges displaying percentages: blue at 70%, orange at 50%, dark red at 55%, and red at 85%.
    Add to Wishlist
    Download
    AI Customize
    Business chart with three line graphs representing data over four years, and yellow, red, and purple captions.
    Add to Wishlist
    Download
    AI Customize
    Horizontal Gantt chart with blue bars representing tasks, timeline from March to April 2020, and gray grid lines.