Project Gantt Chart in PowerPoint for Project Management

Horizontal Gantt chart with blue bars representing tasks, timeline from March to April 2020, and gray grid lines.
P.ID : 34198
    488 views
    29 Downloads
    Get Custom Slides by Experts
    Instantly Access Templates in PowerPoint

    Gantt Chart PowerPoint Template and Google Slides


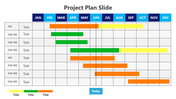
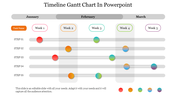
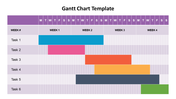
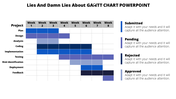
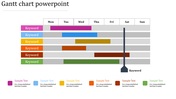
    Visualize project timelines and workflow efficiency with our versatile Gantt Chart PowerPoint Template and Google Slides. Gantt charts are essential tools for project management, allowing teams to track tasks, schedules, and progress effectively.

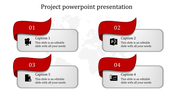
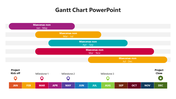
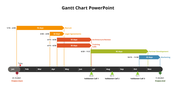
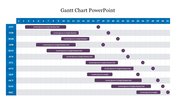
    In our template, blue nodes represent various project tasks and milestones, providing a clear visual representation of the project's timeline. Each node is meticulously designed to emphasize the importance of each task in the overall project plan.

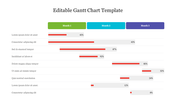
    Utilize this template to showcase the uses of Gantt charts in project management, emphasizing their ability to streamline processes, allocate resources efficiently, and ensure timely project completion. 

    Whether you're presenting project plans, outlining task dependencies, or discussing project timelines, our template offers a professional and visually engaging platform to convey your message effectively.

    Enhance your project presentations with our Gantt Chart PowerPoint Template and Google Slides, and empower your audience with a comprehensive understanding of project management principles and practices. Download now to elevate your project presentations to new heights of clarity and professionalism.

    Features of the template

    • 100% customizable slides and easy to download.
    • Slides are available in different nodes & colors.
    • The slide contains 16:9 and 4:3 formats.
    • It is easy to change the colors of the slide quickly. 
    • Well-crafted template with an instant download facility.
    Advertisement

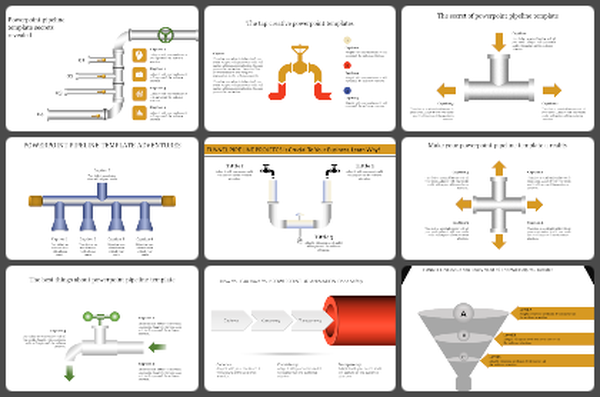
    You May Also Like These PowerPoint Templates

    Free
    Add to Wishlist
    Download
    AI Customize
    Gantt chart with colored bars representing tasks for nine items over two weeks, displayed across a grid layout.
    Add to Wishlist
    Download
    AI Customize
    Gantt chart slide deck with colorful bars showing project schedules, tasks, and deadlines over weekly and monthly timelines.
    Add to Wishlist
    Download
    AI Customize
    Gantt chart slide displaying task schedules across a month with color coded task progress.
    Add to Wishlist
    Download
    AI Customize
    A horizontal Gantt chart showing project timeline with colored bars for tasks and milestones labeled across the months.
    Add to Wishlist
    Download
    AI Customize
    Gantt chart with colored bars displaying tasks across months, showing project progress on a dark background.
    Free
    Add to Wishlist
    Download
    AI Customize
    Simple Gantt chart slide displaying task schedules across three months with each task's duration represented by colored bars.
    Add to Wishlist
    Download
    AI Customize
    Gantt chart slide with horizontal gray task bars and percentage completion for months in a color coded header.
    Add to Wishlist
    Download
    AI Customize
    Gantt chart displaying task progress for seven steps, each represented by colored bars spanning from January to June.
    Add to Wishlist
    Download
    AI Customize
    Gantt chart template showing tasks with percentage completion values, organized along a thirty one days colored timeline.
    Add to Wishlist
    Download
    AI Customize
    Slide with a chart layout showing timeline across four weeks, with tasks in blue, green, yellow, and orange bars.
    Add to Wishlist
    Download
    AI Customize
    Horizontal gantt chart displaying six projects with colored bars showing timelines across months.
    Add to Wishlist
    Download
    AI Customize
    Gantt chart displaying tasks with varying progress percentages over a 31-day timeline using colored bars.
    Add to Wishlist
    Download
    AI Customize
    Project timeline Gantt chart divided into two halves, showcasing task completion levels with gray progress bars.
    Add to Wishlist
    Download
    AI Customize
    Attractive Gantt Chart Sample PowerPoint Presentation
    Add to Wishlist
    Download
    AI Customize
    Gantt chart with seven tasks and their corresponding timeframes, shown in color-coded bars for each day in March 2021.
    Add to Wishlist
    Download
    AI Customize
    Editable Gantt Chart PowerPoint Presentation Template