Stunning Project Gantt Chart In PowerPoint Presentation

Six-month Gantt chart template spanning July to December 2020 with weekly divisions and task rows.
P.ID : 34204
    400 views
    24 Downloads
    Get Custom Slides by Experts
    Instantly Access Templates in PowerPoint

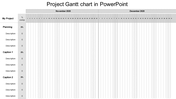
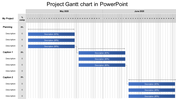
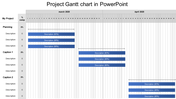
    Elegant Project Gantt Chart For Presentation

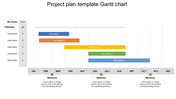
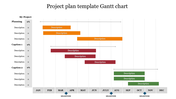
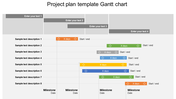
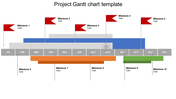
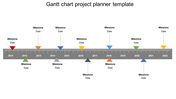
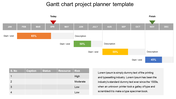
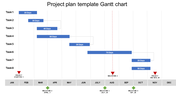
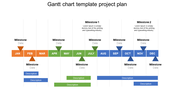
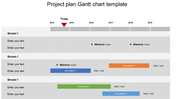
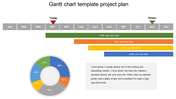
    Illustrate your project plans using our creative Project Gantt chart template. While preparing a Gantt chart might be intimidating, you can create one easily and quickly using this template. The chart includes two parts: the left vertical portions include the tasks, while the top horizontal portions outline the timeline data. They are effortless to keep your project data safely for a long time on the same page. On the other hand, they are super-easy to plan and deliver your project right off. Use the slide and customize it to get the best result. Get now!

     Features of the template

    • 100% customizable slides and easy to download.
    • Slides are available in different nodes & colors.
    • The slide contained 16:9 and 4:3 formats.
    • Easy to change the slide colors quickly.
    • It is a well-crafted template with an instant download facility.
    • Creative slide for the presentation.
    • Best theme slide for celebration.
    Advertisement

    You May Also Like These PowerPoint Templates

    Add to Wishlist
    Download
    AI Customize
    Line chart template with two lines and labeled data points, along with caption blocks on the left.
    Add to Wishlist
    Download
    AI Customize
    A green circular pie chart showing percentage, and four colored sales data graphs for different years.
    Add to Wishlist
    Download
    AI Customize
    A line graph showing a plot structure with key points marked by colored dots, representing key stages.
    Add to Wishlist
    Download
    AI Customize
    A donut chart with multiple segments in different colors next to a table displaying statistics and percentage changes.
    Free
    Add to Wishlist
    Download
    AI Customize
    Slide deck showcasing KWL chart layouts with colorful sections in purple, yellow, and teal, for structured insights.
    Add to Wishlist
    Download
    AI Customize
    Chart guide slide with two green-tone line graphs displaying data points, captions on the right, and a text footer.
    Free
    Add to Wishlist
    Download
    AI Customize
    Pie chart illustration showcasing five data segments in varying colors with percentage labels and connected captions areas.
    Add to Wishlist
    Download
    AI Customize
    Gantt chart slide with horizontal gray task bars and percentage completion for months in a color coded header.
    Add to Wishlist
    Download
    AI Customize
    Gantt chart displaying task progress for seven steps, each represented by colored bars spanning from January to June.
    Add to Wishlist
    Download
    AI Customize
    Gantt chart template showing tasks with percentage completion values, organized along a thirty one days colored timeline.
    Add to Wishlist
    Download
    AI Customize
    Slide with a chart layout showing timeline across four weeks, with tasks in blue, green, yellow, and orange bars.
    Add to Wishlist
    Download
    AI Customize
    Horizontal gantt chart displaying six projects with colored bars showing timelines across months.
    Add to Wishlist
    Download
    AI Customize
    Gantt chart displaying tasks with varying progress percentages over a 31-day timeline using colored bars.
    Add to Wishlist
    Download
    AI Customize
    Project timeline Gantt chart divided into two halves, showcasing task completion levels with gray progress bars.
    Add to Wishlist
    Download
    AI Customize
    Attractive Gantt Chart Sample PowerPoint Presentation
    Add to Wishlist
    Download
    AI Customize
    Gantt chart with seven tasks and their corresponding timeframes, shown in color-coded bars for each day in March 2021.
    Add to Wishlist
    Download
    AI Customize
    Editable Gantt Chart PowerPoint Presentation Template