Dynamic PowerPoint Speedometer Template for Visual Reports

Speedometer design slide with a needle pointing to 70 percent and a caption section.
P.ID : 17004
    244 views
    13 Downloads
    Get Custom Slides by Experts
    Instantly Access Templates in PowerPoint

    Speedometer PowerPoint Template and Google Slides


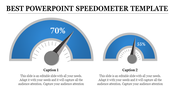
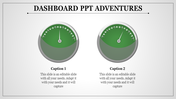
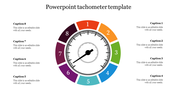
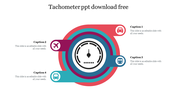
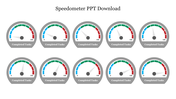
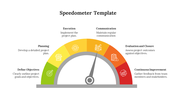
    The "Speedometer PowerPoint Template and Google Slides" offers a dynamic and visually engaging platform for creating presentations related to speed, progress, performance, and metrics tracking. With a vibrant green-colored speedometer at its center, this template provides a compelling visual representation of progress, achievement, and forward momentum. The white background enhances contrast, making the speedometer and accompanying captions stand out prominently, ensuring clarity and impact in conveying key messages.

    This template is ideal for professionals, businesses, educators, and individuals seeking to visualize and communicate progress, performance metrics, goals, and achievements in their presentations. Whether presenting project updates, performance reports, sales figures, or productivity metrics, the speedometer metaphor offers a universally understood symbol of speed, efficiency, and progress. 

    Compatibility with PowerPoint and Google Slides. Available in 16:9 and 4:3 aspect ratios, catering to different screen sizes and presentation preferences. Provided in ZIP format for easy sharing and distribution. 100% customizable features. Download now.
    Advertisement

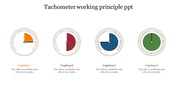
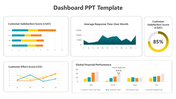
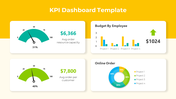
    You May Also Like These PowerPoint Templates

    Add to Wishlist
    Download
    AI Customize
    Semi circular meter template with green, lime, yellow, and red sections, each displaying thumbs up icons, and text.
    Free
    Add to Wishlist
    Download
    AI Customize
    Effective Speedometer PowerPoint Template Presentation
    Add to Wishlist
    Download
    AI Customize
    Executive dashboard with a portfolio summary table listing project details and a pie chart displaying a quarterly report.
    Add to Wishlist
    Download
    AI Customize
    Dashboard template showing main categories, team metrics, and performance details with various visual elements.
    Add to Wishlist
    Download
    AI Customize
    Tachometer slide featuring a dial with a needle pointing to colored segments and four caption areas.
    Add to Wishlist
    Download
    AI Customize
    Set of three speedometer gauges indicating 70%, 50%, and 55%, with placeholder text areas placed in a white backdrop.
    Add to Wishlist
    Download
    AI Customize
    Central black speedometer with four surrounding colored icons, each detailing various aspects of kilometers.
    Add to Wishlist
    Download
    AI Customize
    Dashboard template showing a line chart of page likes over months with marked events in June and August.
    Add to Wishlist
    Download
    AI Customize
    Executive dashboard slide with a colorful line chart for yearly performance.
    Add to Wishlist
    Download
    AI Customize
    Dashboard Model PowerPoint slide showing statistics, graphs, and icons representing business data analysis.
    Add to Wishlist
    Download
    AI Customize
    Dashboard slide with six gauge meters displaying low to high ranges, each labeled with captions below.
    Add to Wishlist
    Download
    AI Customize
    Dashboard with a world map and percentage markers, semi circle expense meters, and orange bar charts showing metrics.
    Add to Wishlist
    Download
    AI Customize
    Circular tachometer design with a central gauge and surrounding colored segments, each linked to captions on the right.
    Add to Wishlist
    Download
    AI Customize
    Dashboard slide with a world map, two semi circular gauges, a pie chart, and a bar graph in a gray and red theme.
    Add to Wishlist
    Download
    AI Customize
    Speedometer template with a needle pointing at 70%, featuring a section in a whote backdrop for a caption areas.