All New Innovative Tachometer Presentation Template

Tachometer slide featuring a dial with a needle pointing to colored segments and four caption areas.
P.ID : 48962
    65 views
    5 Downloads
    Get Custom Slides by Experts
    Instantly Access Templates in PowerPoint

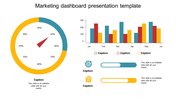
    Four Noded Tachometer PPT Template

    Tachometers are used to measure the operating speed of an engine in revolutions per minute. This Elegant Tachometer PowerPoint Template can be used for all kinds of automobile and business presentations. It is one of the best dashboard templates from SlideEgg. The vivid tachometer clipart diagram at the center gives a vibrant outlook. The four nodes are included with separate caption and narrative space to provide a detailed explanation. Download now for endless benefits.

    Features of the template

    • 100% customizable slides and easy to download.
    • Slides are available in different nodes & colors.
    • The slide contained 16:9 and 4:3 formats.
    • Easy to change the slide colors quickly.
    • Well-crafted template with instant download facility.
    • Fantastic four nodes featured template.
    • Vibrant clipart with elegant nodes.
    Advertisement

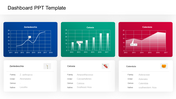
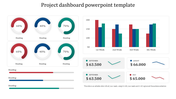
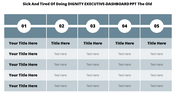
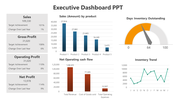
    You May Also Like These PowerPoint Templates

    Add to Wishlist
    Download
    AI Customize
    Project dashboard slides with Gantt chart, a burndown chart, and a timeline, using a palette of brown, green, and red.
    Add to Wishlist
    Download
    AI Customize
    Tachometer PowerPoint slide with gauges indicating 10, 20, and 30 with captions for each.
    Free
    Add to Wishlist
    Download
    AI Customize
    Dashboard with a timeline bar chart in green and purple, labeled with milestones for savings and investments.
    Add to Wishlist
    Download
    AI Customize
    Sales performance dashboard template in red displaying revenue, recent sales, user data, and session metrics visually.
    Add to Wishlist
    Download
    AI Customize
    Dashboard showing from defect rate trends upto delivery time analysis in mixed orange and brown theme.
    Add to Wishlist
    Download
    AI Customize
    KPI slide with four semi circular gauges displaying metrics and overlapping colored circles showing numerical data.
    Add to Wishlist
    Download
    AI Customize
    KPI dashboard layout with bar charts, a gauge, captions, and target metrics on light gray background, organized in sections.
    Add to Wishlist
    Download
    AI Customize
    Concentric pentagons in black with text areas around each corner, forming a simple monochrome layout.
    Add to Wishlist
    Download
    AI Customize
    Horizontal infographic with four tachometer icons in gradient colors, labeled with captions for each gauge.
    Add to Wishlist
    Download
    AI Customize
    Slide featuring a tachometer dial with four performance levels and linked captions in red, yellow, maroon, and blue.
    Add to Wishlist
    Download
    AI Customize
    Dashboard layout with charts in orange tones, including a donut chart, bar graphs, and a line chart for monthly data.
    Add to Wishlist
    Download
    AI Customize
    Slide with four red speedometers, each indicating a different percentage level, against a white background.
    Add to Wishlist
    Download
    AI Customize
    Cash flow dashboard with a vertical bar chart and two horizontal stacked bar charts detailing revenue categories.
    Add to Wishlist
    Download
    AI Customize
    Blue themed dashboard layout with a line chart, two growth metrics, and three semi circle gauges for budget.
    Free
    Add to Wishlist
    Download
    AI Customize
    Circular speedometer with orange and gray segments, displaying kilometer markings from 5.5 KM to 8 KM.